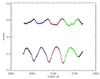
Fig. 8

Top: minimum and maximum brightness as a function of time. Data for different Blashko cycles are plotted using different colors. Middle: same as the top but for the phase of both minimum and maximum brightness. Bottom: maximum brightness-maximum phase plot, with sixth order harmonics fits, of CoRoT ID 0105288363 at the first (black), second (blue), third (red), and fourth Blazhko period (green). The arrows indicate the direction of the modulation.


Current usage metrics show cumulative count of Article Views (full-text article views including HTML views, PDF and ePub downloads, according to the available data) and Abstracts Views on Vision4Press platform.
Data correspond to usage on the plateform after 2015. The current usage metrics is available 48-96 hours after online publication and is updated daily on week days.
Initial download of the metrics may take a while.