Fig. 1
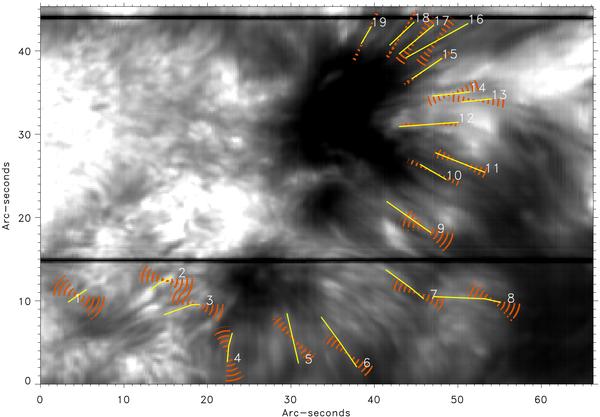
Field of view observed with SPINOR in the core of Ca ii 8542 Å. Yellow lines: fibrils selected for analysis. The yellow segments define the direction of the three-pixel wide bands used for Stokes Q and U profile averaging. Red cones: range of magnetic-field azimuth compatible with the Q and U profiles. The spatial sampling is  /pixel.
Current usage metrics show cumulative count of Article Views (full-text article views including HTML views, PDF and ePub downloads, according to the available data) and Abstracts Views on Vision4Press platform.
Data correspond to usage on the plateform after 2015. The current usage metrics is available 48-96 hours after online publication and is updated daily on week days.
Initial download of the metrics may take a while.