Fig. 9
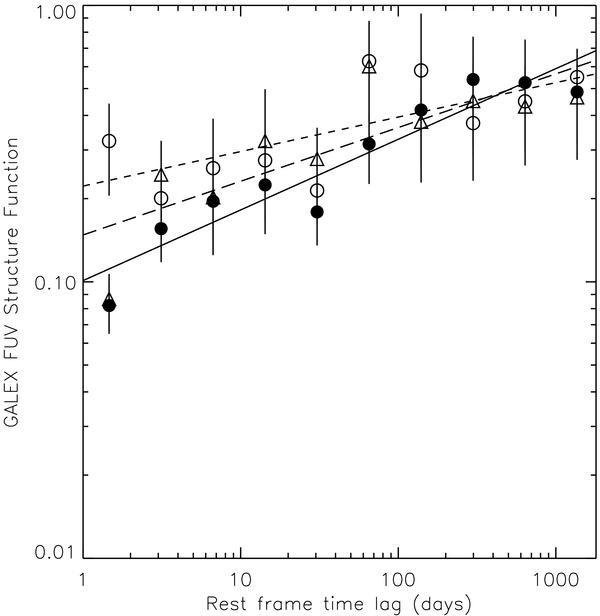
Log − Log plots of the FUV structure function (in 3 redshift bins) with respect to the rest frame time lags for the variable quasars. The data are shown for the same 10 bins of time lags as Fig. 7, with the data averages plotted for redshift bins of size 0 < z < 0.47 (open circles), 0.47 < z < 1.33 (filled circles) and z > 1.33 (open triangles). The vertical lines represent error bars for the binned data points. Linear best-fits are also shown for each of the redshift bin data sets; long dashed line (open circle data), full line (filled circle data) and short dashed line (open triangle data). None of these linear fits match the FUV data for time-lags > 300 days.
Current usage metrics show cumulative count of Article Views (full-text article views including HTML views, PDF and ePub downloads, according to the available data) and Abstracts Views on Vision4Press platform.
Data correspond to usage on the plateform after 2015. The current usage metrics is available 48-96 hours after online publication and is updated daily on week days.
Initial download of the metrics may take a while.