Fig. 7
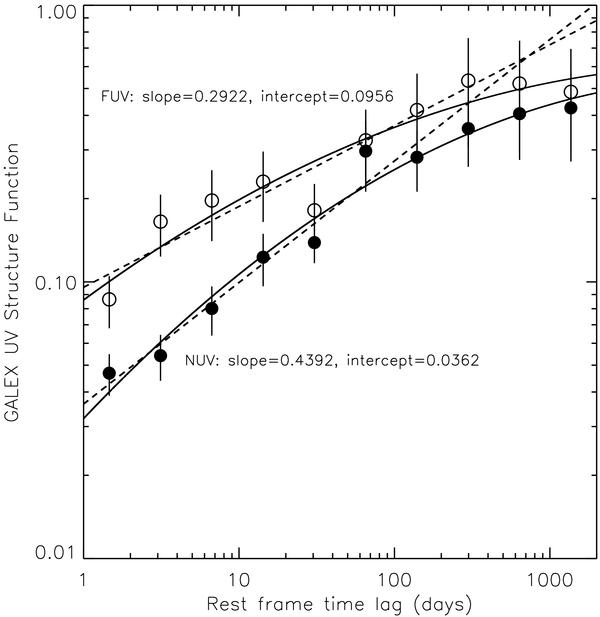
Log − Log plots of the NUV (filled circles) and FUV (open circles) structure functions with respect to the rest frame time lags for the UV-variable quasars. The data averages are shown in 10 bins of equal logarithmically spaced time lags. Best fit straight lines (dashed) and quadratic fits (full line) are shown for both Structure Functions. Both sets of data reveal a flattening of their structure functions for time lags > 300 days.
Current usage metrics show cumulative count of Article Views (full-text article views including HTML views, PDF and ePub downloads, according to the available data) and Abstracts Views on Vision4Press platform.
Data correspond to usage on the plateform after 2015. The current usage metrics is available 48-96 hours after online publication and is updated daily on week days.
Initial download of the metrics may take a while.