Fig. 5
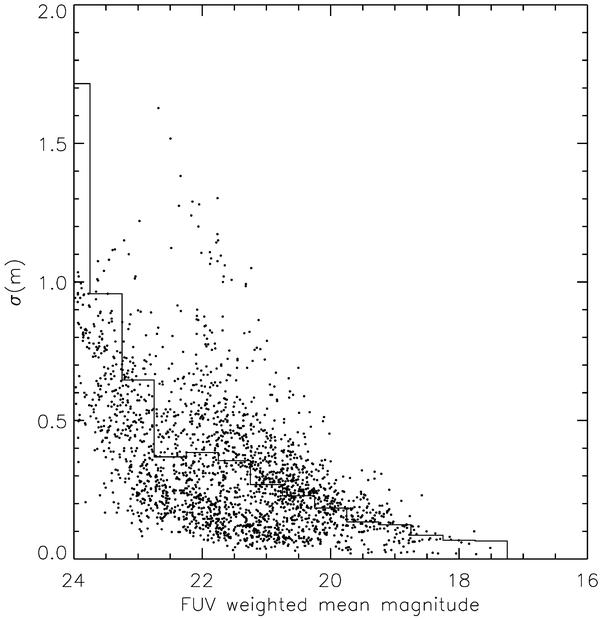
Plot of the standard deviation (σ) from the weighted mean (⟨ m ⟩) of a series of observed FUV magnitudes (m) for the sample of quasars with ≥ 5 observational visits by GALEX. Superposed on this plot (full line) is the theoretical 3-σ variance from the measured mean FUV magnitude. Only points above this variance were selected as being statistically variable in the FUV.
Current usage metrics show cumulative count of Article Views (full-text article views including HTML views, PDF and ePub downloads, according to the available data) and Abstracts Views on Vision4Press platform.
Data correspond to usage on the plateform after 2015. The current usage metrics is available 48-96 hours after online publication and is updated daily on week days.
Initial download of the metrics may take a while.