Free Access
Fig. 14
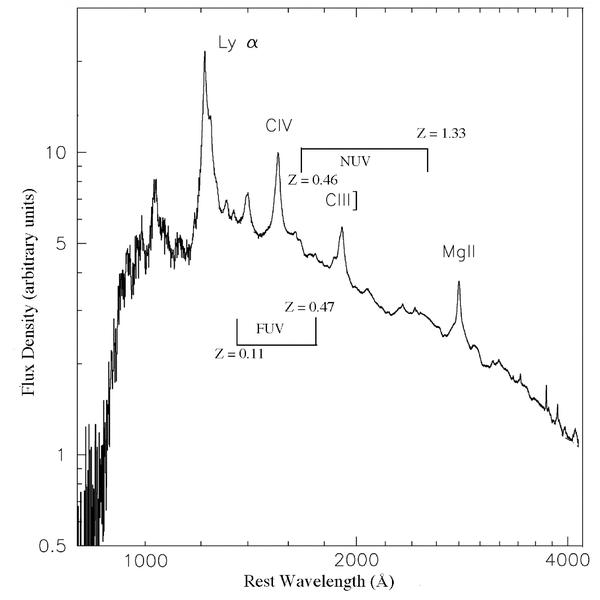
UV-visible spectrum of a zero redshift quasar showing the most prominent emission lines. Also shown are the GALEX FUV and NUV passbands together with the redshift (z) values at which Ly-α emission enters and leaves each of the passbands (adapted from Vanden Berk et al. 2001)
Current usage metrics show cumulative count of Article Views (full-text article views including HTML views, PDF and ePub downloads, according to the available data) and Abstracts Views on Vision4Press platform.
Data correspond to usage on the plateform after 2015. The current usage metrics is available 48-96 hours after online publication and is updated daily on week days.
Initial download of the metrics may take a while.