Fig. 12
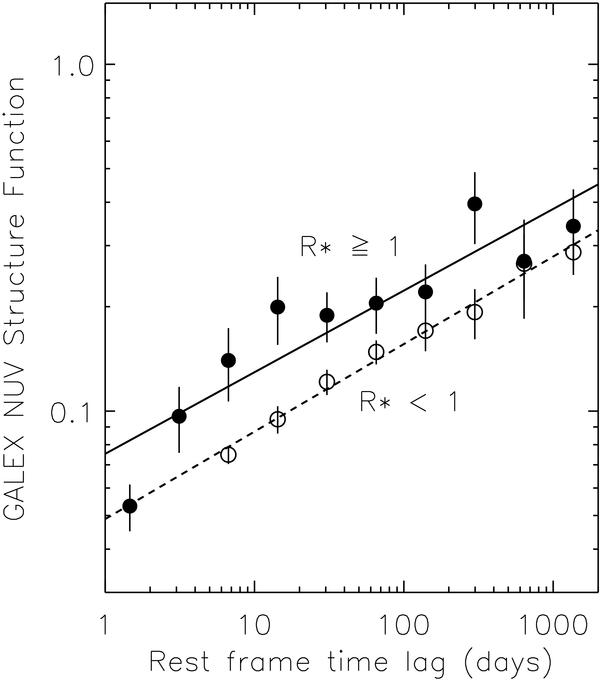
Log − Log plot of the NUV structure function as a function of rest frame time-lag for radio bright UVQs (R ∗ > 1, filled circles) and radio quiet (R ∗ < 1, open circles) UVQs, as detected by the VLA 20 cm FIRST survey. Best fit straight lines are shown for each of the two data sets. The radio bright NUV data are best fit with a line of slope 0.25 (intercept 0.05) and the radio faint sources with a similar slope of 0.24 (intercept 0.08).
Current usage metrics show cumulative count of Article Views (full-text article views including HTML views, PDF and ePub downloads, according to the available data) and Abstracts Views on Vision4Press platform.
Data correspond to usage on the plateform after 2015. The current usage metrics is available 48-96 hours after online publication and is updated daily on week days.
Initial download of the metrics may take a while.