Fig. 11
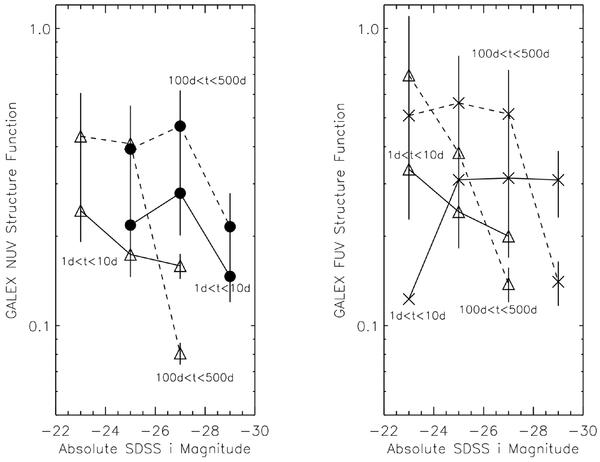
Log−Log plots of the NUV (left) and FUV (right) structure functions as a function of quasar luminosity (absolute i magnitude) for our sample of UV variable objects for rest frame time-lags of 1 d < 10d and 100d < 500d for QSOs with redshifts of 0.5 < z < 0.9 (open triangles) and z > 2.03 (filled circles) for the NUV data, and redshifts of 0.5 < z < 0.9 (open triangles) and 1.4 < z < 2.03 (asterisks). The data points have been connected by a continuous line for the 1 d < 10d data, and by a dashed line for the 100d < 500d data for ease of viewing.
Current usage metrics show cumulative count of Article Views (full-text article views including HTML views, PDF and ePub downloads, according to the available data) and Abstracts Views on Vision4Press platform.
Data correspond to usage on the plateform after 2015. The current usage metrics is available 48-96 hours after online publication and is updated daily on week days.
Initial download of the metrics may take a while.