Fig. 10
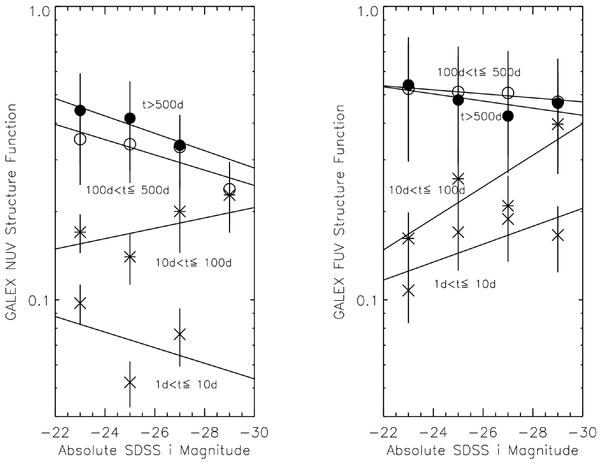
Plots of the NUV (left) and FUV (right) structure functions as a function of quasar luminosity (absolute i magnitude) for our sample of UV variable objects. The data are plotted in bins of 2 mag width and are shown for four rest frame time-lags (t) of 1d < t ≤ 10d (crosses), 10d < t ≤ 100d (asterisks), 100d < t ≤ 500d (open circles) and > 500d (filled circles) for both the NUV and FUV observations. Best-fit lines to the data points are also shown, revealing that NUV and FUV variability amplitudes are greater at longer time-lags than for shorter time-lags for all values of QSO luminosity
Current usage metrics show cumulative count of Article Views (full-text article views including HTML views, PDF and ePub downloads, according to the available data) and Abstracts Views on Vision4Press platform.
Data correspond to usage on the plateform after 2015. The current usage metrics is available 48-96 hours after online publication and is updated daily on week days.
Initial download of the metrics may take a while.