Fig. 3
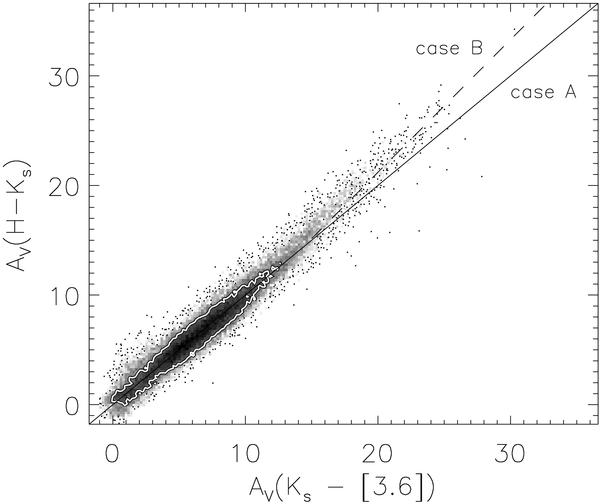
Extinction from H − Ks color excess versus extinction from Ks − [3.6] color excess. By adjusting Ks − [3.6] to obtain a one-to-one regression line (solid line) we find A [3.6] /AKs = 0.611. The white iso-density contour delineates the region used to compute de regression line. The dashed line is the regression line for AV > 20 mag, it indicates the deviation at large extinction. Case A and B refer to Table 2.
Current usage metrics show cumulative count of Article Views (full-text article views including HTML views, PDF and ePub downloads, according to the available data) and Abstracts Views on Vision4Press platform.
Data correspond to usage on the plateform after 2015. The current usage metrics is available 48-96 hours after online publication and is updated daily on week days.
Initial download of the metrics may take a while.