Fig. 1
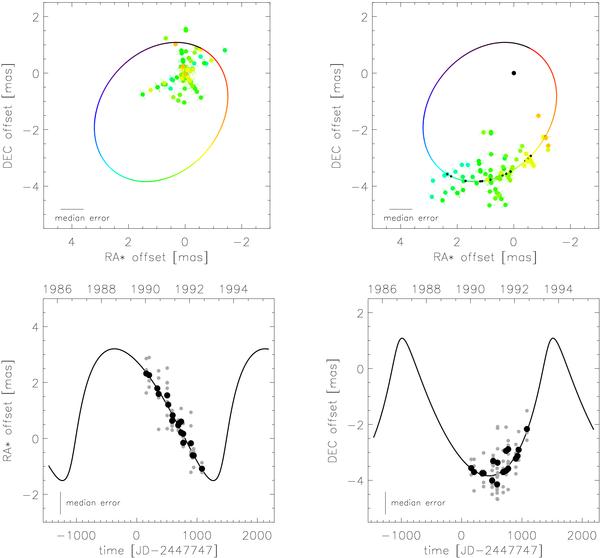
Illustration of abscissa residuals from Hipparcos along with the astrometric orbit as fitted for ϵ Eri. The two panels in the top row show the abscissa residuals (colored dots) with respect to the standard astrometric model without orbiting companion (upper left) and with respect to a model (solid line) which includes the companion (upper right). The colored lines indicate the direction which was not measured and along which the dots are allowed to slide in the adjustment process; the actual abscissa measurement is perpendicular to that line. Color indicates orbital phase. The two panels in the bottom row show only one dimension each as a function of time. The solid line is the orbital model as in the upper panels, while the small grey dots are the individual abscissa residuals. The big black dots are averages of abscissa residuals taken very closely in time. The information about the orientation of the abscissa residuals is missing in the panels in the bottom row.
Current usage metrics show cumulative count of Article Views (full-text article views including HTML views, PDF and ePub downloads, according to the available data) and Abstracts Views on Vision4Press platform.
Data correspond to usage on the plateform after 2015. The current usage metrics is available 48-96 hours after online publication and is updated daily on week days.
Initial download of the metrics may take a while.