Fig. 3
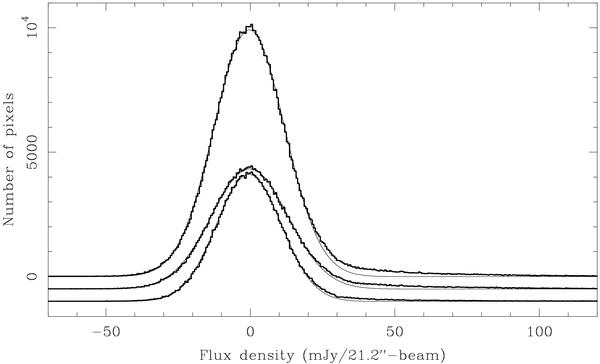
Flux density distribution in the full map of Cha I (upper histogram), in fields Cha-Center and Cha-South (middle histogram), and in fields Cha-North and Cha-West (lower histogram). The middle and lower histograms were shifted vertically by –500 and –1000, respectively, for clarity. A Gaussian fit is overlaid as a thin line on each histogram. The Gaussian standard deviation is 12.2, 13.3, and 11.2 mJy/21.2″-beam for the full map, for fields Cha-Center and Cha-South, and for fields Cha-North and Cha-West, respectively.
Current usage metrics show cumulative count of Article Views (full-text article views including HTML views, PDF and ePub downloads, according to the available data) and Abstracts Views on Vision4Press platform.
Data correspond to usage on the plateform after 2015. The current usage metrics is available 48-96 hours after online publication and is updated daily on week days.
Initial download of the metrics may take a while.