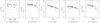
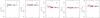
Fig. A.1

Statistical properties of 60 artificial, circular, Gaussian sources inserted into the raw time signals before data reduction a) to e) or directly inserted into the final unsmoothed continuum emission map of Cha I f) to j). a) and f): ratio of output to input peak flux density as a function of input peak flux density. b) and g): ratio of output to input peak flux density as a function of input size (FWHM). c) and h): ratio of output major size to input size as a function of input size. d) and i): ratio of output minor size to input size as a function of input size. e) and j): ratio of output to input total flux as a function of input size. The size of the black symbols scales with the input size of the sources. In addition, crosses and plus symbols are for input peak flux densities below and above 150 mJy/19.2″-beam, respectively. The red circles in panels b) to e) and g) to j) show a fit to the data points using the arbitrary 3-parameter function y = log (α / (1 + (x / β)γ)).
Current usage metrics show cumulative count of Article Views (full-text article views including HTML views, PDF and ePub downloads, according to the available data) and Abstracts Views on Vision4Press platform.
Data correspond to usage on the plateform after 2015. The current usage metrics is available 48-96 hours after online publication and is updated daily on week days.
Initial download of the metrics may take a while.