Fig. 14
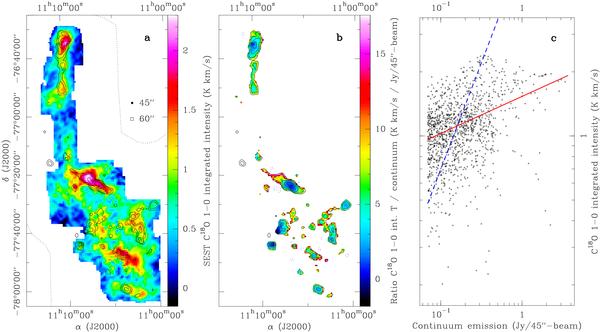
a) Integrated intensity map of C18O 1–0 emission detected
with the SEST by Haikala et al. (2005) in
 scale. The
870 μm continuum map smoothed to 45″ is overlaid as contours.
The contours are − f (dotted blue), f,
2f, 4f, 8f,
16f, and 32f, with
f = 4σ and σ the rms noise
level (23 mJy/45″-beam). The dotted line delimits the field mapped at
870 μm. The filled circle shows the SEST angular resolution,
and the square the sampling of the C18O map. b) Ratio of
C18O 1–0 integrated intensity to 870 μm continuum
flux density with a 870 μm clip at 4σ. The
contours are the same as in a). c) Correlation between
the C18O 1–0 integrated intensity and the 870 μm
continuum emission. Only data points with a C18O 1–0 integrated
intensity higher than 0.2 K km s-1 (>3σ for 90%
of the map) and a 870 μm flux density higher than 69 mJy/45″-beam
(3σ) are plotted. The red line shows the result of a linear fit
over the full range. The blue dashed line has a slope of 1 in log-log space and
its vertical position is arbitrary.
scale. The
870 μm continuum map smoothed to 45″ is overlaid as contours.
The contours are − f (dotted blue), f,
2f, 4f, 8f,
16f, and 32f, with
f = 4σ and σ the rms noise
level (23 mJy/45″-beam). The dotted line delimits the field mapped at
870 μm. The filled circle shows the SEST angular resolution,
and the square the sampling of the C18O map. b) Ratio of
C18O 1–0 integrated intensity to 870 μm continuum
flux density with a 870 μm clip at 4σ. The
contours are the same as in a). c) Correlation between
the C18O 1–0 integrated intensity and the 870 μm
continuum emission. Only data points with a C18O 1–0 integrated
intensity higher than 0.2 K km s-1 (>3σ for 90%
of the map) and a 870 μm flux density higher than 69 mJy/45″-beam
(3σ) are plotted. The red line shows the result of a linear fit
over the full range. The blue dashed line has a slope of 1 in log-log space and
its vertical position is arbitrary.
Current usage metrics show cumulative count of Article Views (full-text article views including HTML views, PDF and ePub downloads, according to the available data) and Abstracts Views on Vision4Press platform.
Data correspond to usage on the plateform after 2015. The current usage metrics is available 48-96 hours after online publication and is updated daily on week days.
Initial download of the metrics may take a while.