Fig. 13
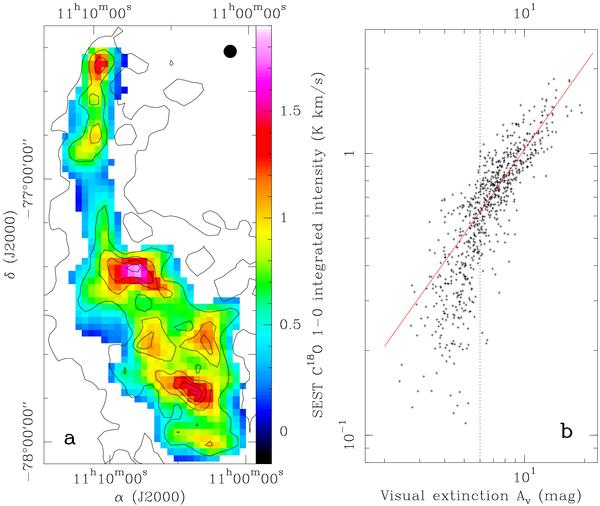
a) Integrated intensity map of C18O 1–0 emission detected
with the SEST by Haikala et al. (2005) in
 scale,
smoothed to an effective angular resolution of 3′ (filled circle). The extinction
map of Fig. 1 is overlaid as contours that
increase from 3 to 18 mag by step of 3 mag. b) Correlation between
the C18O 1–0 integrated intensity and the visual extinction. Only data
points with a C18O 1–0 integrated intensity higher than 0.1
K km s-1 (>3σ for 90% of the map) and
AV > 2 mag are plotted. The dotted line marks
the extinction AV = 6 mag above which a linear fit
with a fixed slope of 1 (in log-log space) was performed. The red line shows the
result of this fit. Note that all visual extinction values where derived assuming
the standard extinction law and have to be multiplied by 0.85 for
AV above ~6 mag (see Appendix B.3).
scale,
smoothed to an effective angular resolution of 3′ (filled circle). The extinction
map of Fig. 1 is overlaid as contours that
increase from 3 to 18 mag by step of 3 mag. b) Correlation between
the C18O 1–0 integrated intensity and the visual extinction. Only data
points with a C18O 1–0 integrated intensity higher than 0.1
K km s-1 (>3σ for 90% of the map) and
AV > 2 mag are plotted. The dotted line marks
the extinction AV = 6 mag above which a linear fit
with a fixed slope of 1 (in log-log space) was performed. The red line shows the
result of this fit. Note that all visual extinction values where derived assuming
the standard extinction law and have to be multiplied by 0.85 for
AV above ~6 mag (see Appendix B.3).
Current usage metrics show cumulative count of Article Views (full-text article views including HTML views, PDF and ePub downloads, according to the available data) and Abstracts Views on Vision4Press platform.
Data correspond to usage on the plateform after 2015. The current usage metrics is available 48-96 hours after online publication and is updated daily on week days.
Initial download of the metrics may take a while.