Fig. 11
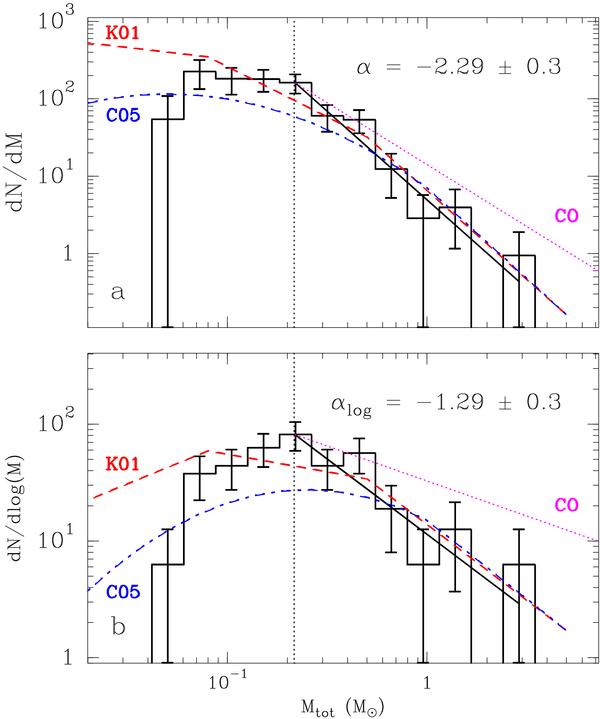
Mass distribution dN / dMa) and
dN / dlog (M) b) of the 60
starless (or Class 0) sources. The error bars represent the Poisson noise (in
 ).
The vertical dotted line is the estimated 90% completeness limit. The thick solid
line is the best power-law fit performed on the mass bins above the completeness
limit. The best fit exponent, α and
αlog , respectively, is given in the upper right
corner of each panel. The IMF of single stars corrected for binaries (Kroupa 2001, K01) and the IMF of multiple
systems (Chabrier 2005, C05) are shown in
dashed (red) and dot-dashed (blue) lines, respectively. They are both vertically
shifted to the same number at 5 M⊙. The dotted
(purple) curve is the typical mass spectrum of CO clumps (Blitz 1993; Kramer et al.
1998).
).
The vertical dotted line is the estimated 90% completeness limit. The thick solid
line is the best power-law fit performed on the mass bins above the completeness
limit. The best fit exponent, α and
αlog , respectively, is given in the upper right
corner of each panel. The IMF of single stars corrected for binaries (Kroupa 2001, K01) and the IMF of multiple
systems (Chabrier 2005, C05) are shown in
dashed (red) and dot-dashed (blue) lines, respectively. They are both vertically
shifted to the same number at 5 M⊙. The dotted
(purple) curve is the typical mass spectrum of CO clumps (Blitz 1993; Kramer et al.
1998).
Current usage metrics show cumulative count of Article Views (full-text article views including HTML views, PDF and ePub downloads, according to the available data) and Abstracts Views on Vision4Press platform.
Data correspond to usage on the plateform after 2015. The current usage metrics is available 48-96 hours after online publication and is updated daily on week days.
Initial download of the metrics may take a while.