Fig. 7
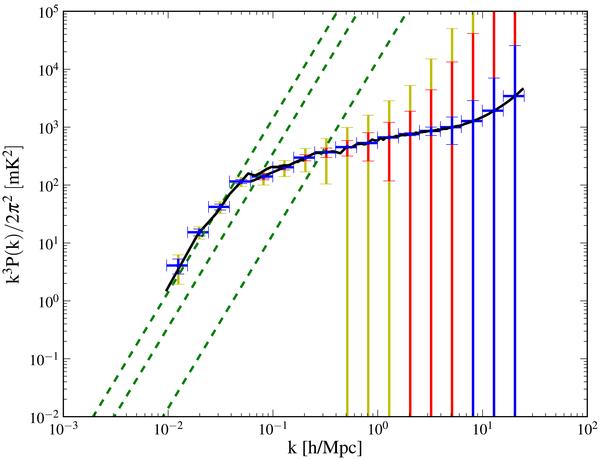
Error on the 3d 21 cm power spectrum at z = 20.25
( )
assuming an SKA type experiment. Solid black – signal for simulations S1+S2; dashed
green – noise power spectrum (equation 12) for the full SKA collecting area, 20% and
10% (increasing amplitude). The expected error taking into account the available
number of modes (Eq. (7)) is shown with error bars in blue, red and yellow
respectively. Measurement of the large scale power spectrum should be possible as
long as the signal amplitude is not 100 times smaller than current value (this is
controlled by
xα/(1 + xα)(1 − Tγ/TS)
so it should be fine for
xα > 0.01). On large scales it
should be possible to measure the signal even with only 10% of the collecting
area.
)
assuming an SKA type experiment. Solid black – signal for simulations S1+S2; dashed
green – noise power spectrum (equation 12) for the full SKA collecting area, 20% and
10% (increasing amplitude). The expected error taking into account the available
number of modes (Eq. (7)) is shown with error bars in blue, red and yellow
respectively. Measurement of the large scale power spectrum should be possible as
long as the signal amplitude is not 100 times smaller than current value (this is
controlled by
xα/(1 + xα)(1 − Tγ/TS)
so it should be fine for
xα > 0.01). On large scales it
should be possible to measure the signal even with only 10% of the collecting
area.
Current usage metrics show cumulative count of Article Views (full-text article views including HTML views, PDF and ePub downloads, according to the available data) and Abstracts Views on Vision4Press platform.
Data correspond to usage on the plateform after 2015. The current usage metrics is available 48-96 hours after online publication and is updated daily on week days.
Initial download of the metrics may take a while.