Fig. 1
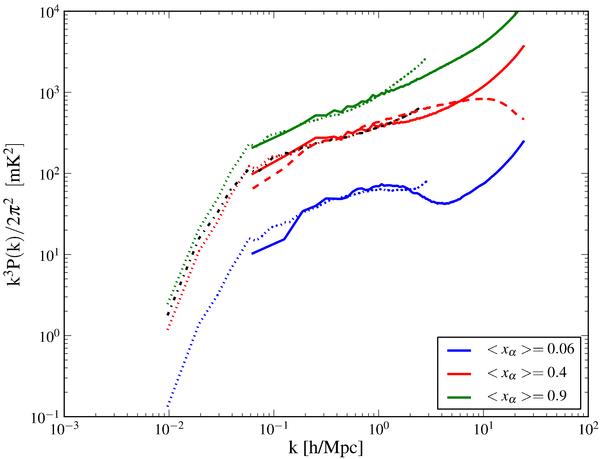
The 21 cm brightness temperature with all fluctuations included. Dotted – simulation S1, solid – simulation S2, dashed – simulation S3. Redshifts from top to bottom are: 19.25 (⟨ xα ⟩ = 0.9), 20.25 (⟨ xα ⟩ = 0.4), 22.5 (⟨ xα ⟩ = 0.06). The black dash-dotted line shows the correction for ⟨ xα ⟩ = 0.4 when doing the full Lyα flux inhomogeneous integration.
Current usage metrics show cumulative count of Article Views (full-text article views including HTML views, PDF and ePub downloads, according to the available data) and Abstracts Views on Vision4Press platform.
Data correspond to usage on the plateform after 2015. The current usage metrics is available 48-96 hours after online publication and is updated daily on week days.
Initial download of the metrics may take a while.