Fig. 5
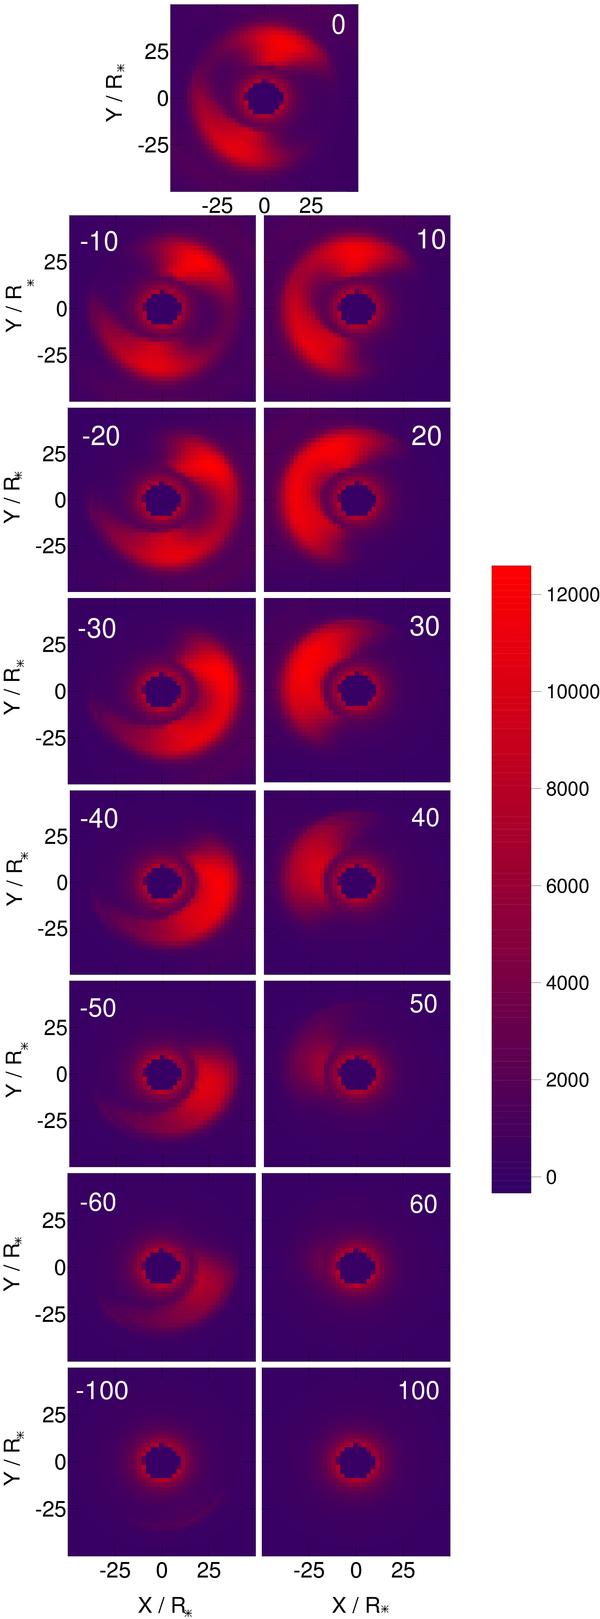
Intensity distributions of our best-fit disk-wind model 5 (i.e., intensity distribution of the continuum disk plus the disk wind; the central star is not shown; see Tables 3 and A.1) at the center of the Brγ line (v = 0 km s-1) and at 14 other velocities (the labels give the velocity in km s-1). For the calculation of the model images in this figure, a clockwise motion of the disk wind was assumed. Therefore, in the blue-shifted images (left panels), mainly the disk regions on the right hand side of the star are bright. The radius of the inner edge of the disk wind ejection region (i.e., radius of the inner hole) is ω1 = 17.5 R∗ (~0.3 AU). The inclination angle (angle between the polar axis and the viewing direction) of the model is i = 20° (i.e., almost pole-on). The colors represent the intensity in erg ster-1 s-1 Å-1 cm-2. In these images, AMBER’s spectral resolution of 12 000 was modeled, as described in Sect. A.3.
Current usage metrics show cumulative count of Article Views (full-text article views including HTML views, PDF and ePub downloads, according to the available data) and Abstracts Views on Vision4Press platform.
Data correspond to usage on the plateform after 2015. The current usage metrics is available 48-96 hours after online publication and is updated daily on week days.
Initial download of the metrics may take a while.