Fig. 9
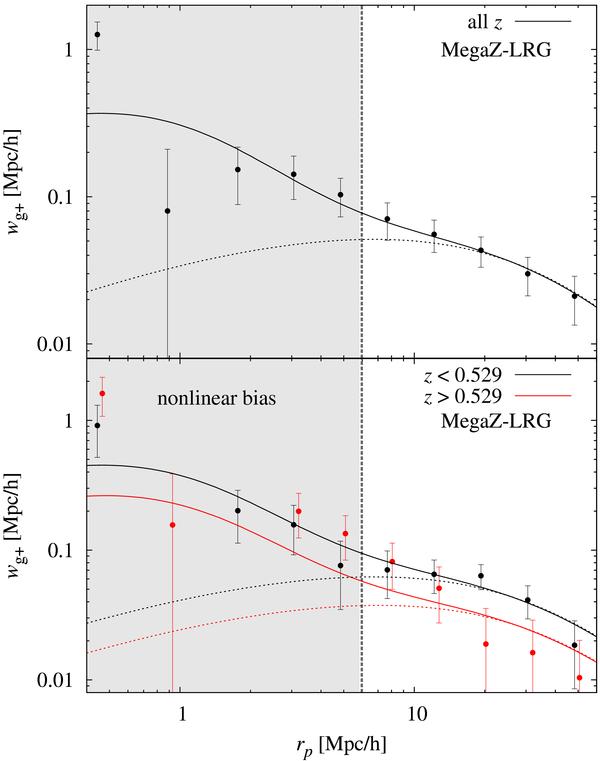
Projected correlation function wg + as a function of comoving transverse separation rp for different MegaZ-LRG subsamples. Top panel: shown is wg + for the MegaZ-LRG sample with the full range in redshifts. The black solid curve corresponds to the best-fit model when only varying the amplitude A, without contributions by galaxy-galaxy lensing. The dotted black line is obtained by using the linear matter power spectrum instead of the full power spectrum including non-linear corrections, and identical model parameters otherwise. Bottom panel: same as above, but for the MegaZ-LRG sample split into two photometric redshift bins, where results for z < 0.529 are shown in black, and for z > 0.529 in red. Dotted lines again correspond to models computed from the linear matter power spectrum. The point for the z < 0.529 subsample at rp ≈ 1 h-1 Mpc is negative and thus not shown. Note that the red points have been slightly offset horizontally for clarity, and that the error bars are correlated. Only the data points outside the grey region have been used for the fits.
Current usage metrics show cumulative count of Article Views (full-text article views including HTML views, PDF and ePub downloads, according to the available data) and Abstracts Views on Vision4Press platform.
Data correspond to usage on the plateform after 2015. The current usage metrics is available 48-96 hours after online publication and is updated daily on week days.
Initial download of the metrics may take a while.