Fig. 8
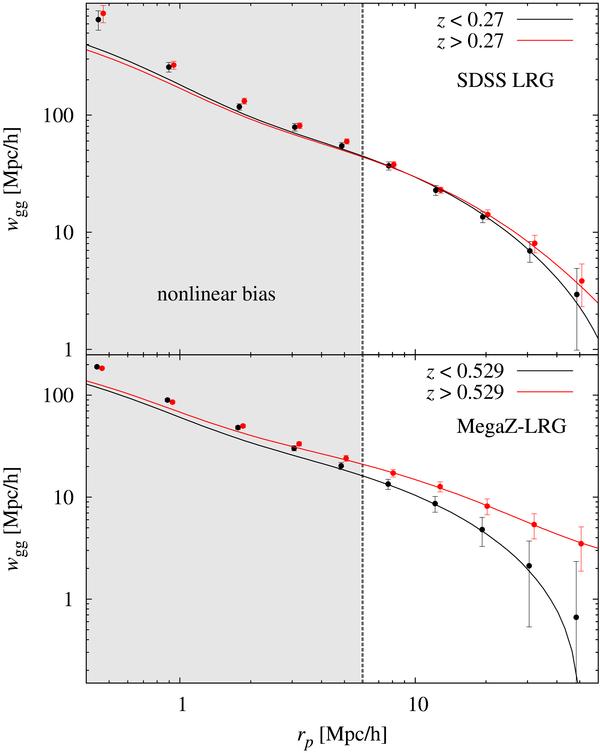
Projected correlation function wgg as a function of comoving transverse separation rp. Top panel: for the SDSS LRG sample with redshifts smaller than 0.27 (black) and with redshifts larger than 0.27 (red). Bottom panel: for the MegaZ-LRG sample with photometric redshifts smaller than 0.529 (black) and with photometric redshifts larger than 0.529 (red). Note that the red points have been slightly offset horizontally for clarity, and that the error bars are strongly correlated. In addition we show the best-fit models as black and red curves, respectively. Only the data points outside the grey region have been used for the fits to avoid the regime of nonlinear bias.
Current usage metrics show cumulative count of Article Views (full-text article views including HTML views, PDF and ePub downloads, according to the available data) and Abstracts Views on Vision4Press platform.
Data correspond to usage on the plateform after 2015. The current usage metrics is available 48-96 hours after online publication and is updated daily on week days.
Initial download of the metrics may take a while.