Fig. 7
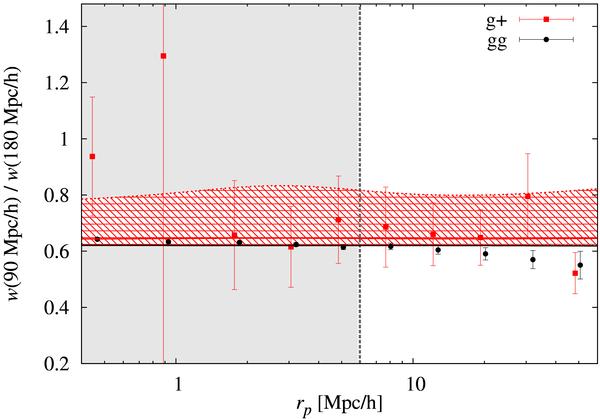
Effect of the cut-off in Π in the projection of the three-dimensional correlation
functions along the line of sight. Shown is the ratio of the projected correlation
function computed for  h-1 Mpc
over the correlation function obtained with
h-1 Mpc
over the correlation function obtained with  h-1 Mpc,
for both the galaxy clustering signal (gg, in black) and number density-shape
correlations (g+, in red). Points are computed from the MegaZ-LRG data, using the
full range in redshifts. Note that the black points have been slightly offset
horizontally for clarity. The black line is obtained from the model for
wgg. The red hatched region comprises the range of
ratios for wg + with different relative strengths of
the galaxy-galaxy lensing contribution. The red solid line indicates the ratio
resulting for the best-fit intrinsic alignment amplitude determined in Sect. 5.3. Note that the error bars at different
transverse separations are correlated, in particular for
wgg at large
rp, see Fig. 6.
h-1 Mpc,
for both the galaxy clustering signal (gg, in black) and number density-shape
correlations (g+, in red). Points are computed from the MegaZ-LRG data, using the
full range in redshifts. Note that the black points have been slightly offset
horizontally for clarity. The black line is obtained from the model for
wgg. The red hatched region comprises the range of
ratios for wg + with different relative strengths of
the galaxy-galaxy lensing contribution. The red solid line indicates the ratio
resulting for the best-fit intrinsic alignment amplitude determined in Sect. 5.3. Note that the error bars at different
transverse separations are correlated, in particular for
wgg at large
rp, see Fig. 6.
Current usage metrics show cumulative count of Article Views (full-text article views including HTML views, PDF and ePub downloads, according to the available data) and Abstracts Views on Vision4Press platform.
Data correspond to usage on the plateform after 2015. The current usage metrics is available 48-96 hours after online publication and is updated daily on week days.
Initial download of the metrics may take a while.