Fig. 4
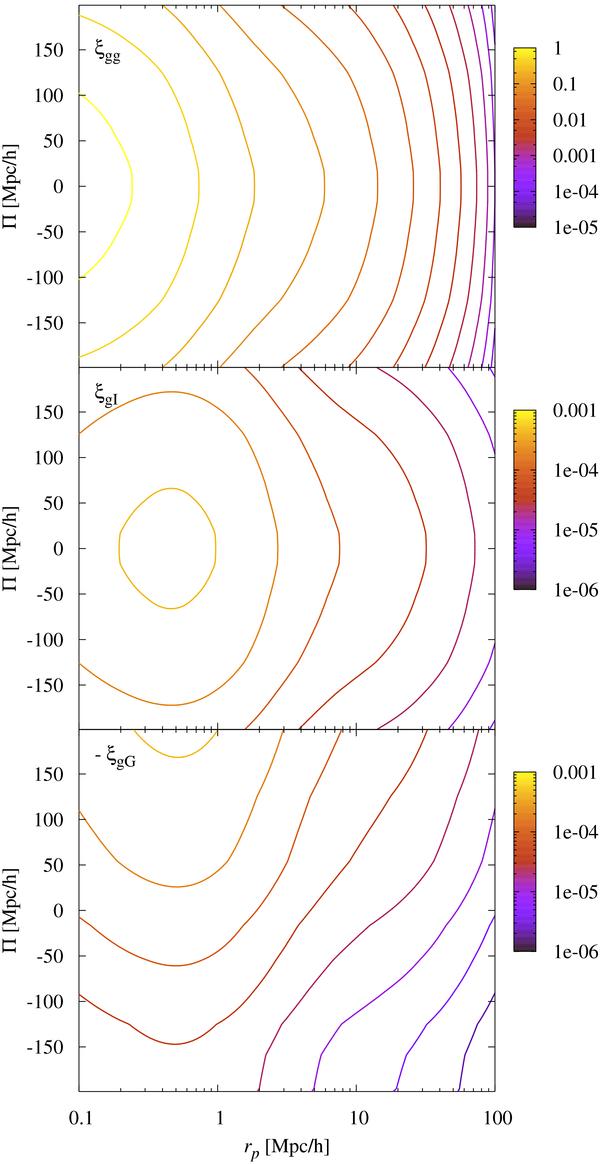
Three-dimensional correlation function models of a sample with the MegaZ-LRG photometric redshift error as a function of comoving line-of-sight separation Π and comoving transverse separation rp at zm ≈ 0.5. The galaxy bias has been set to 1.9 in all panels. Top panel: galaxy clustering correlation (gg). Contours are logarithmically spaced between 1 (yellow shading) and 10-5 (violet shading) with three lines per decade. Centre panel: galaxy number density-intrinsic shear correlations (gI). Contours are logarithmically spaced between 10-3 (yellow shading) and 10-6 (violet shading) with three lines per decade. Bottom panel: galaxy-galaxy lensing (gG). For ease of direct comparison, the contours are encoded exactly like in the centre panel. Note that the galaxy-galaxy lensing signal is not symmetric around Π = 0, in contrast to the gg and gI terms. Also, it is negative, so that the modulus is plotted. For an illustration of the effect of photometric redshift scatter see Fig. A.1.
Current usage metrics show cumulative count of Article Views (full-text article views including HTML views, PDF and ePub downloads, according to the available data) and Abstracts Views on Vision4Press platform.
Data correspond to usage on the plateform after 2015. The current usage metrics is available 48-96 hours after online publication and is updated daily on week days.
Initial download of the metrics may take a while.