Fig. 2
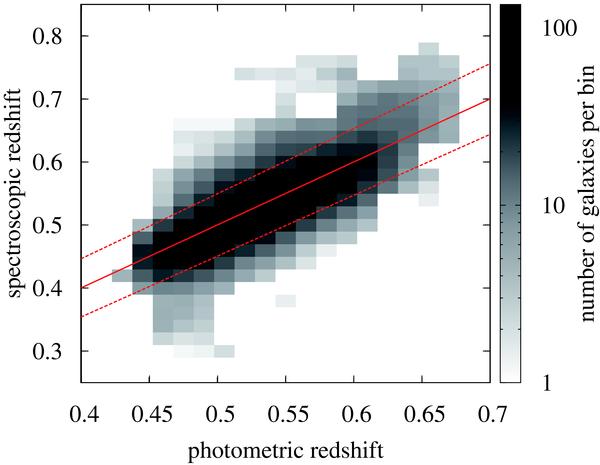
Binned histogram of spectroscopic redshifts from 2SLAQ and photometric redshift estimates from the MegaZ-LRG catalogue. Note that the shading of the bins is logarithmic. The solid line indicates a one-to-one relation between spectroscopic and photometric redshifts, coinciding with the mean trend to high accuracy. The dotted lines correspond to the ± 1σ scatter.
Current usage metrics show cumulative count of Article Views (full-text article views including HTML views, PDF and ePub downloads, according to the available data) and Abstracts Views on Vision4Press platform.
Data correspond to usage on the plateform after 2015. The current usage metrics is available 48-96 hours after online publication and is updated daily on week days.
Initial download of the metrics may take a while.