Fig. 17
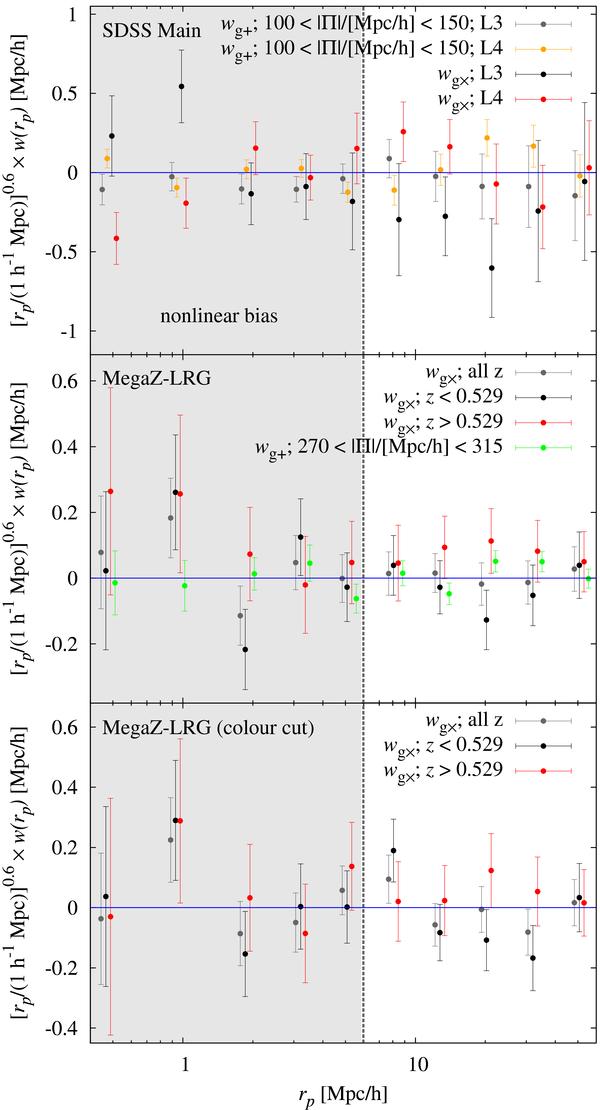
Projected correlation functions wg × and wg + for large line-of-sight separations as a function of comoving transverse separation rp. Top panel: shown is wg × for the re-defined SDSS Main L4 (red points) and L3 (black points) samples. Moreover wg + integrated along the line of sight for 100 < |Π| / [h-1Mpc] < 150 is plotted as grey points for L3 and orange points for L4. Note that the orange, black, and red points have been slightly offset horizontally for clarity. Centre panel: shown is wg × for the full MegaZ-LRG sample in grey, for the low-redshift sample with z < 0.529 in black, and for the high-redshift sample with z > 0.529 in red. In addition we plot the correlation function wg + for the full MegaZ-LRG sample, integrated along the line of sight for 270 < |Π| / [h-1Mpc] < 315, as green points. Note that the black, red, and green points have been slightly offset horizontally for clarity. Bottom panel: same as in centre panel, but for the MegaZ-LRG sample with the colour cut imposed. Note that we did not repeat the computation of wg + for large |Π| . Error bars at different rp are correlated. Note that all correlation functions have been rescaled by [rp/(1 h-1Mpc)] 0.6 for easier inspection. All signals are consistent with zero.
Current usage metrics show cumulative count of Article Views (full-text article views including HTML views, PDF and ePub downloads, according to the available data) and Abstracts Views on Vision4Press platform.
Data correspond to usage on the plateform after 2015. The current usage metrics is available 48-96 hours after online publication and is updated daily on week days.
Initial download of the metrics may take a while.