Fig. 16
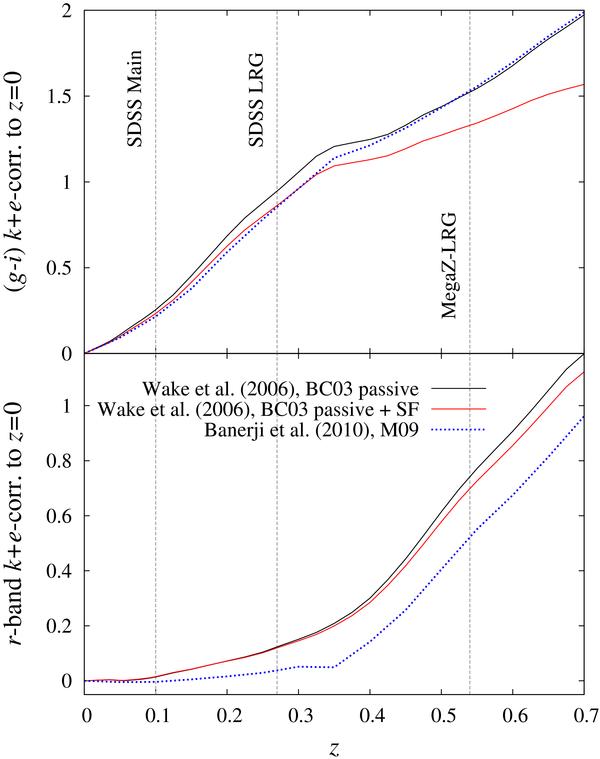
k + e-corrections to z = 0 using different sets of templates. Top panel: k + e-corrections in the colour g − i used to determine the compatibility in colour ranges of the galaxy samples. The black curve corresponds to the templates used in this work by Wake et al. (2006) which are based on the stellar population synthesis code by Bruzual & Charlot (2003) using passive evolution. If a low level of continuous star formation is added to the model, the red solid line results. In addition we show the k + e-corrections from Banerji et al. (2010) using population synthesis models by Maraston et al. (2009) as the blue dotted curve. Bottom panel: k + e-corrections in the r band in which we compute galaxy luminosities. The coding of the curves is the same as above. The grey vertical lines indicate typical redshifts of the samples under consideration.
Current usage metrics show cumulative count of Article Views (full-text article views including HTML views, PDF and ePub downloads, according to the available data) and Abstracts Views on Vision4Press platform.
Data correspond to usage on the plateform after 2015. The current usage metrics is available 48-96 hours after online publication and is updated daily on week days.
Initial download of the metrics may take a while.