Fig. 15
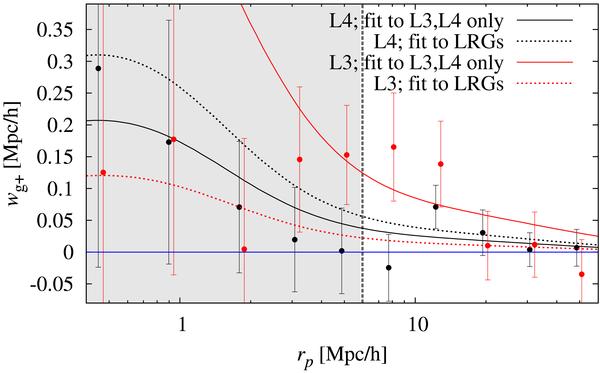
Consistency between the combined LRG and SDSS Main samples. Shown is wg + for the red SDSS L4 (in black) and L3 (in red) samples. The solid curves correspond to the best-fit models to the combined L3 and L4 samples when varying A, ηother, and β. The corresponding best-fit models to the combined SDSS LRG and MegaZ-LRG samples are given by the dotted lines. The prior ranges A ∈ [0;20], ηother ∈ [ − 10;10], and β ∈ [−5;5] were employed in both cases. Note that the red points have been slightly offset horizontally for clarity, and that the error bars are correlated.
Current usage metrics show cumulative count of Article Views (full-text article views including HTML views, PDF and ePub downloads, according to the available data) and Abstracts Views on Vision4Press platform.
Data correspond to usage on the plateform after 2015. The current usage metrics is available 48-96 hours after online publication and is updated daily on week days.
Initial download of the metrics may take a while.