Fig. 11
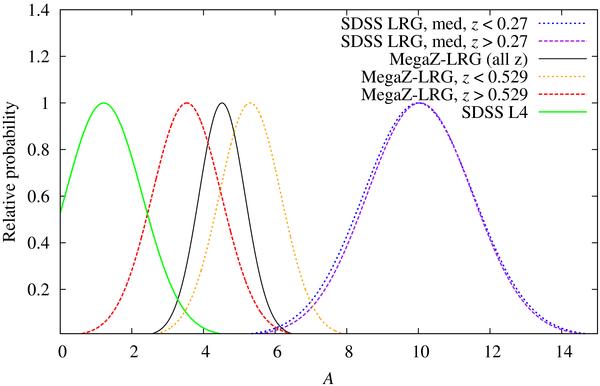
Constraints on the amplitude A of the intrinsic alignment model. The black solid curve corresponds to using the full MegaZ-LRG sample. The constraints from the individual MegaZ-LRG redshift bins are shown as red dashed lines (z > 0.529) and orange dotted lines (z < 0.529). For comparison we also show the constraints on A for the SDSS L4 sample as green solid line and for the SDSS LRG medium luminosity samples with z < 0.27 (dark blue dotted line) and z > 0.27 (purple dashed line).
Current usage metrics show cumulative count of Article Views (full-text article views including HTML views, PDF and ePub downloads, according to the available data) and Abstracts Views on Vision4Press platform.
Data correspond to usage on the plateform after 2015. The current usage metrics is available 48-96 hours after online publication and is updated daily on week days.
Initial download of the metrics may take a while.