Fig. 1
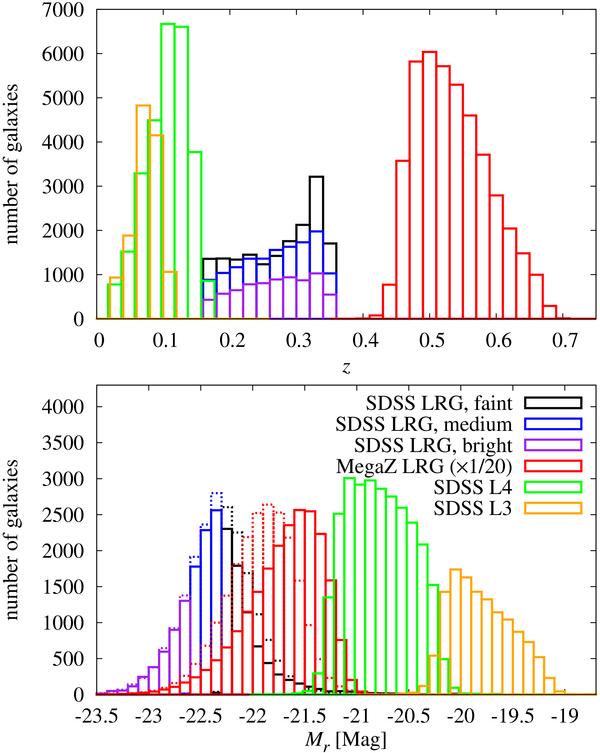
Top panel: redshift distributions of the galaxy samples analysed. Shown are the histograms for the SDSS LRG samples in black (faint, Mr > −22.3), blue (medium, −22.6 < Mr < − 22.3), and purple (bright, Mr < −22.6), for the full MegaZ-LRG sample in red, and for the SDSS Main samples in green (L4) and orange (L3). Note that both SDSS LRG and MegaZ-LRG samples are split into two redshift bins each, the SDSS LRG samples at z = 0.27 and the MegaZ-LRG sample at z = 0.529. Bottom panel: distribution of rest-frame absolute magnitudes Mr. The colour coding of the histograms is the same as in the top panel. In the case of the SDSS LRG and MegaZ-LRG samples solid lines correspond to the low redshift bin, dotted lines to the high redshift bin, respectively. Note that the MegaZ-LRG histograms rely on photometric redshift estimates, and that they have been downscaled by a factor of 20 to facilitate the comparison with the other samples.
Current usage metrics show cumulative count of Article Views (full-text article views including HTML views, PDF and ePub downloads, according to the available data) and Abstracts Views on Vision4Press platform.
Data correspond to usage on the plateform after 2015. The current usage metrics is available 48-96 hours after online publication and is updated daily on week days.
Initial download of the metrics may take a while.