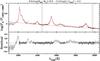
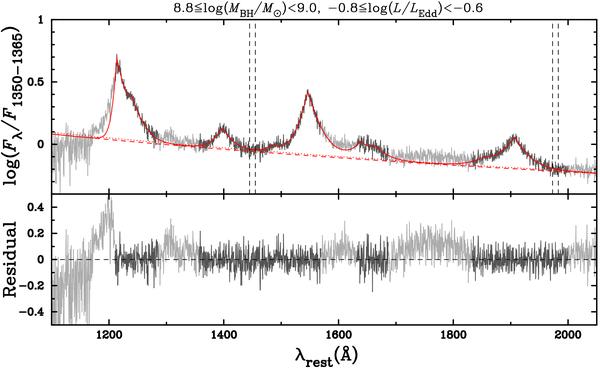
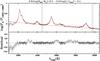
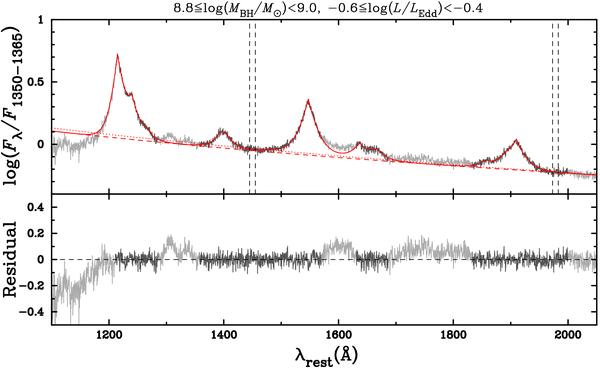
Fig. 4

Composite spectra of each quasar subsample and fitting results, shown in the logarithmic scale (upper panels). The residuals are shown in the lower panels. Dark gray lines show the wavelength regions used for the fitting, while the wavelength regions excluded from the fitting process are shown in light gray. The spectral regions denoted by vertical dashed lines are used to determine the initial guess of the continuum level and slope in the fitting process. The initial guess and the fitted power-law continuum are denoted by red dotted and dashed lines, respectively.


Current usage metrics show cumulative count of Article Views (full-text article views including HTML views, PDF and ePub downloads, according to the available data) and Abstracts Views on Vision4Press platform.
Data correspond to usage on the plateform after 2015. The current usage metrics is available 48-96 hours after online publication and is updated daily on week days.
Initial download of the metrics may take a while.