Fig. 6
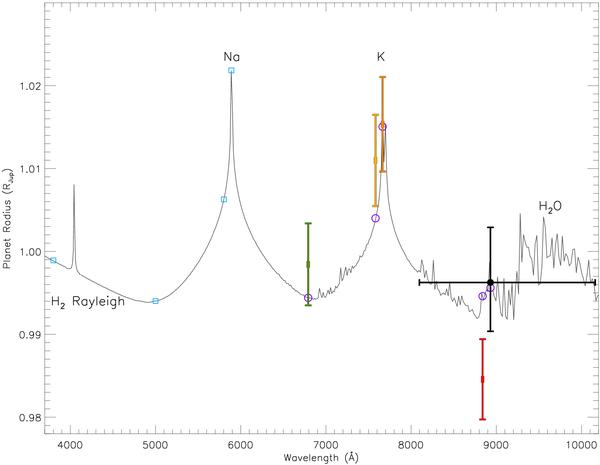
Same as Fig. 3, but over-plotted with a XO-2b specific model of the transmission spectrum, which uses a dayside-averaged temperature-pressure profile. The model is dominated in the optical by Na and K absorption signatures. Compared with the isothermal model of Fig. 3, the lower temperatures at higher-altitudes in this model lead to a better fit of the K-core 7664.9 Å measurement. Additional observations are planned at blue wavelengths (blue boxes), which will be highly sensitive to atmospheric sodium, and will help provide a more complete picture of the transmission spectrum.
Current usage metrics show cumulative count of Article Views (full-text article views including HTML views, PDF and ePub downloads, according to the available data) and Abstracts Views on Vision4Press platform.
Data correspond to usage on the plateform after 2015. The current usage metrics is available 48-96 hours after online publication and is updated daily on week days.
Initial download of the metrics may take a while.