Fig. 3
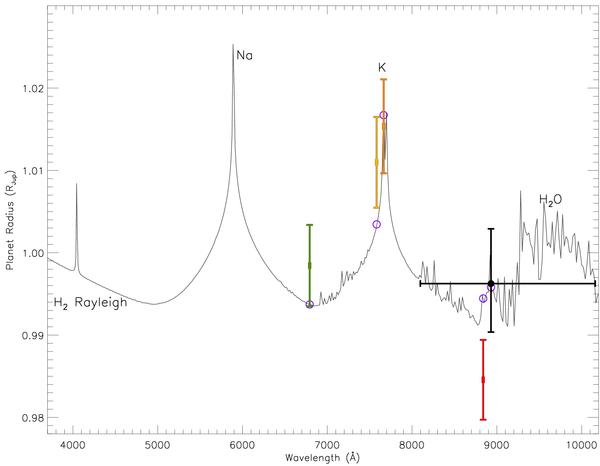
XO-2b narrowband GTC photometric results at four wavelengths (colored points) along with the z-band radius (black dot) of Fernandez et al. (2009). The X-axis error bars indicate the wavelength range of the photometry, while the Y-axis error bars indicates the errors on the measured planetary radius, assuming a stellar radius of 0.976 R⊙. Also over-plotted is a 1500 K isothermal model (binned to R = 500) of the transmission spectrum from Fortney et al. (2010) adapted for XO-2b, which is dominated by gaseous Na and K. TiO and VO opacities are removed in this model. The open circles indicate the predicted filter-integrated model values.
Current usage metrics show cumulative count of Article Views (full-text article views including HTML views, PDF and ePub downloads, according to the available data) and Abstracts Views on Vision4Press platform.
Data correspond to usage on the plateform after 2015. The current usage metrics is available 48-96 hours after online publication and is updated daily on week days.
Initial download of the metrics may take a while.