Fig. 2
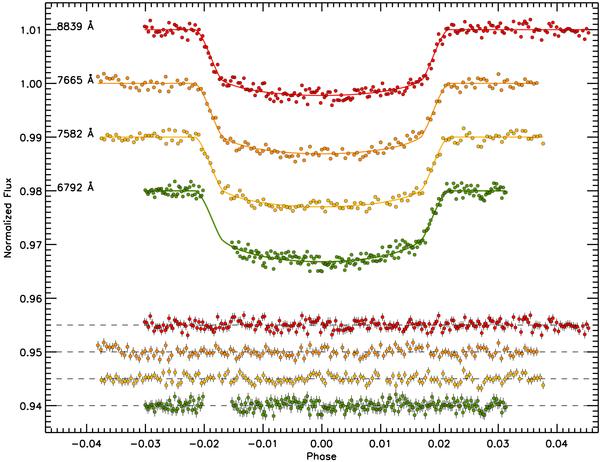
GTC OSIRIS narrowband transit light curves at (top-to-bottom) 8839, 7665, 7582, and 6792 Å, with an arbitrary flux offset applied to each curve for clarity. The best-fit models are also over-plotted, along with the residuals (bottom four curves), which have a y-axis error bar corresponding to the per-point flux uncertainty. The light curves are near-Poisson limited, with per-point S/N levels between 1149 and 1351.
Current usage metrics show cumulative count of Article Views (full-text article views including HTML views, PDF and ePub downloads, according to the available data) and Abstracts Views on Vision4Press platform.
Data correspond to usage on the plateform after 2015. The current usage metrics is available 48-96 hours after online publication and is updated daily on week days.
Initial download of the metrics may take a while.