Fig. 9
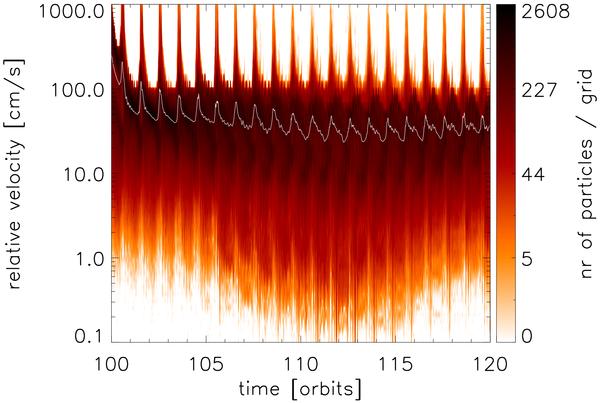
The relative velocity distribution of aggregates as a function of time in the “fiducial” simulation. The x axis is in orbital time units, the y axis is the relative velocity in cm/s. The colors indicate how many particles are present at a given location of the parameter space. The white solid line shows the average relative velocity of all particles as a function of time.
Current usage metrics show cumulative count of Article Views (full-text article views including HTML views, PDF and ePub downloads, according to the available data) and Abstracts Views on Vision4Press platform.
Data correspond to usage on the plateform after 2015. The current usage metrics is available 48-96 hours after online publication and is updated daily on week days.
Initial download of the metrics may take a while.