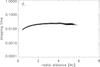
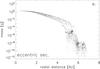
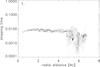
Fig. 8
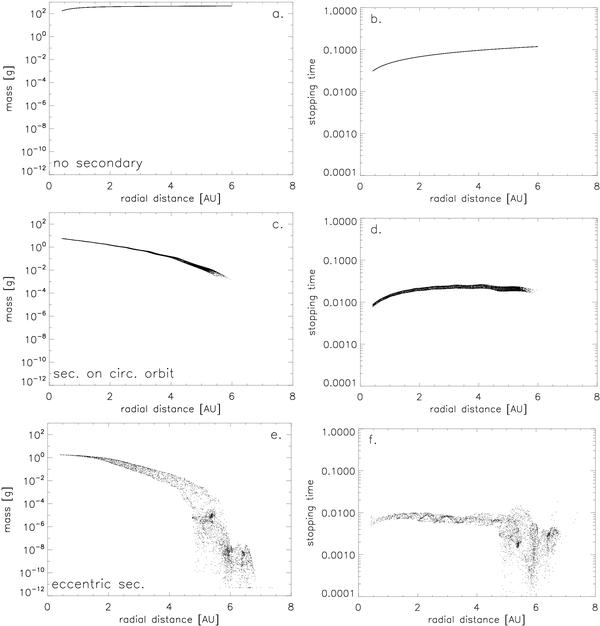
The figures on the left side a), c), e) show the mass of the particles as a function of their distance from the primary at t = 120 orbits for the “single”, “no_ecc”, and “fiducial” simulations respectively. The figures on the right side b), d), f) show the corresponding stopping times of the particles at the same time.
Current usage metrics show cumulative count of Article Views (full-text article views including HTML views, PDF and ePub downloads, according to the available data) and Abstracts Views on Vision4Press platform.
Data correspond to usage on the plateform after 2015. The current usage metrics is available 48-96 hours after online publication and is updated daily on week days.
Initial download of the metrics may take a while.