Fig. 10
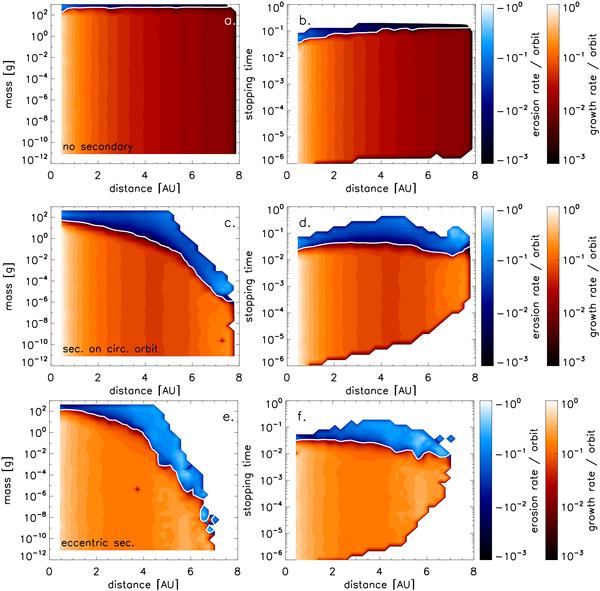
The figures on the left side a), c), e) show the growth/erosion rates of particles in the “single”, “no_ecc”, and “fiducial” simulations, respectively. The x axis is the distance from the primary in AU units, and the y axis is the mass of the particles in gram. The red contours (below the white line) illustrate the growth rate, white meaning that the particle doubled in mass during one orbit. The blue contours (above the white line) represents erosion rates, white in this case meaning that the particle completely eroded in one orbit. The figures on the right side b), d), f) show the same quantities, but the stopping time is plotted on the y axis. The white solid line indicates the equilibrium between growth and erosion.
Current usage metrics show cumulative count of Article Views (full-text article views including HTML views, PDF and ePub downloads, according to the available data) and Abstracts Views on Vision4Press platform.
Data correspond to usage on the plateform after 2015. The current usage metrics is available 48-96 hours after online publication and is updated daily on week days.
Initial download of the metrics may take a while.