| Issue |
A&A
Volume 527, March 2011
|
|
|---|---|---|
| Article Number | A37 | |
| Number of page(s) | 8 | |
| Section | Stellar structure and evolution | |
| DOI | https://doi.org/10.1051/0004-6361/201015370 | |
| Published online | 21 January 2011 | |
Asteroseismic modelling of the solar-type subgiant star β Hydri
1
Centro de Astrofísica da Universidade do Porto,
Rua das Estrelas, 4150-762
Porto, Portugal
e-mail: isa@astro.up.pt
2
Departamento de Física e Astronomia, Faculdade de Ciências da
Universidade do Porto, Portugal
3
Department of Physics and Astronomy, Aarhus
University, 8000
Aarhus C,
Denmark
4 Sydney Institute for Astronomy
(SIFA), School of Physics, University of Sydney,
Australia
5
High Altitude Observatory and Technology Development
Division, NCAR,
Boulder, Colorado, USA
6
Observatoire de Paris, LESIA, 5 place Jules Janssen, 92195
Meudon Cedex,
France
Received: 9 July 2010
Accepted: 22 November 2010
Context. Comparing models and data of pulsating stars is a powerful way to understand the stellar structure better. Moreover, such comparisons are necessary to make improvements to the physics of the stellar models, since they do not yet perfectly represent either the interior or especially the surface layers of stars. Because β Hydri is an evolved solar-type pulsator with mixed modes in its frequency spectrum, it is very interesting for asteroseismic studies.
Aims. The goal of the present work is to search for a representative model of the solar-type star β Hydri, based on up-to-date non-seismic and seismic data.
Methods. We present a revised list of frequencies for 33 modes, which we produced by analysing the power spectrum of the published observations again using a new weighting scheme that minimises the daily sidelobes. We ran several grids of evolutionary models with different input parameters and different physics, using the stellar evolutionary code ASTEC. For the models that are inside the observed error box of β Hydri, we computed their frequencies with the pulsation code ADIPLS. We used two approaches to find the model that oscillates with the frequencies that are closest to the observed frequencies of β Hydri: (i) we assume that the best model is the one that reproduces the star’s interior based on the radial oscillation frequencies alone, to which we have applied the correction for the near-surface effects; (ii) we assume that the best model is the one that produces the lowest value of the chi-square (χ2), i.e. that minimises the difference between the observed frequencies of all available modes and the model predictions, after all model frequencies are corrected for near-surface effects.
Results. We show that after applying a correction for near-surface effects to the frequencies of the best models, we can reproduce the observed modes well, including those that have mixed mode character. The model that gives the lowest value of the χ2 is a post-main-sequence model with a mass of 1.04 M⊙ and a metallicity slightly lower than that of the Sun. Our results underscore the importance of having individual frequencies to constrain the properties of the stellar model.
Key words: asteroseismology / stars: solar-type / stars: individual:βHydri
© ESO, 2011
1. Introduction
The source β Hydri (β Hyi, HD 2151, HR 98, HIP 2021) is a single, bright subgiant star (mV = 2.80) that is clearly visible to the naked eye about 12° from the South Pole. It is the closest subgiant star, with a spectral and luminosity type between G2 IV (Hoffleit & Warren 1995; Evans et al. 1957) and G0 V (Gray et al. 2006), and it is one of the oldest stars in the solar Galactic neighbourhood. It is frequently regarded as representing the future of the Sun (Dravins et al. 1993c,b,a), making it a particularly interesting object of study.
Improvements to the fundamental parameters of β Hyi have been presented in a number of recent papers. Recent interferometric measurements of β Hyi have yielded an accurate (0.8%) angular diameter for this star (North et al. 2007). Also, the Hipparcos parallax of β Hyi has been improved from an uncertainty of 0.4% (Perryman & ESA 1997) to 0.08% (van Leeuwen 2007). The combination of these two values gives a direct measure of β Hyi’s radius with high accuracy. Moreover, since the bolometric flux of this star is known (Blackwell & Lynas-Gray 1998), its position in the Hertzprung-Russell (HR) diagram is, in principle, well-constrained.
Frandsen (1987) and Edmonds & Cram (1995) made unsuccessful attempts to detect stellar oscillations in β Hyi, placing upper limits on the p-mode amplitudes. Bedding et al. (2001) and Carrier et al. (2001) finally confirmed the presence of solar-like oscillations in β Hyi and estimated the large frequency separation Δν to be about 55 μHz, but were unable to identify individual mode frequencies. Subsequently, Bedding et al. (2007) observed β Hyi during more than a week with the high-precision spectrographs HARPS and UCLES. Besides confirming the oscillations detected in their previous observations in 2000, they were able to identify 28 oscillation modes that included some mixed modes of spherical degree l = 1. Mixed modes occur in stars that have left the main-sequence stage of their evolution (e.g. Osaki 1975; Aizenman et al. 1977), and they provide useful information about the core. The presence of mixed modes, together with the availability of very precise non-seismic and seismic data for β Hyi, places the star in a privileged position for asteroseismic studies (e.g. Cunha et al. 2007).
Theoretical models of β Hyi based on its seismic and non-seismic data have been published by Fernandes & Monteiro (2003), Di Mauro et al. (2003), and Doǧan et al. (2009). Fernandes & Monteiro (2003) examined the position of β Hyi in the HR diagram by first considering the non-seismic data of the star. In order to estimate the mass of β Hyi, they used available seismic data, namely the large frequency separation, to remove partially the helium-content vs. mass degeneracy that exists when only non-seismic observational constraints are used. They also emphasized the usefulness of individual frequencies to constrain the age of β Hyi due to the presence of mixed modes in its observed oscillation spectrum. Di Mauro et al. (2003) computed models of β Hyi, also based on its global parameters. They used the oscillation frequencies of β Hyi to compare with the model frequencies. Their theoretical models reproduced the observed oscillation spectrum of β Hyi well, as well as the observed large and small frequency separations, after they applied an ad-hoc shift to the computed frequencies. In fact, when comparing the computed and the observed frequencies, one should bear in mind that there may be an offset between them. This offset is well known from helioseismology and is also present when comparing the observed and computed frequencies for other stars. It arises from improper modelling of the surface layers of stars. Kjeldsen et al. (2008) used solar data to derive an empirical correction for the near-surface offset which can be applied to stars other than the Sun. In our work, we apply this empirical correction to the model frequencies of β Hyi before comparing to the observed ones. We extend the analysis of Doǧan et al. (2009), and also present a detailed discussion on the application of the near-surface correction.
2. Observational constraints
2.1. Non-seismic data
The most recent determination of the radius of β Hyi is given by Kjeldsen et al. (2008). The radius was obtained by combining the interferometric angular diameter of the star, θ = 2.257 ± 0.019 mas (North et al. 2007), with the revised Hipparcos parallax, πp = 134.07 ± 0.11 mas (van Leeuwen 2007).
The luminosity, L, of a star can be obtained through the relation,
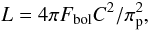 (1)where Fbol is the
bolometric flux and C is the conversion factor from parsecs to metres. To
compute the luminosity of β Hyi we used the same value for the bolometric
flux as North et al. (2007),
Fbol = (2.019 ± 0.05) × 109 W m-2
(Blackwell & Lynas-Gray 1998, the uncertainty
on Fbol is from di Benedetto
1998) and the revised Hipparcos parallax (van Leeuwen 2007). Adopting
L⊙ = 3.842 × 1026 W with an uncertainty of 0.4%
(Bahcall et al. 2001), we found
L = 3.494 ± 0.087 L⊙ for
β Hyi.
(1)where Fbol is the
bolometric flux and C is the conversion factor from parsecs to metres. To
compute the luminosity of β Hyi we used the same value for the bolometric
flux as North et al. (2007),
Fbol = (2.019 ± 0.05) × 109 W m-2
(Blackwell & Lynas-Gray 1998, the uncertainty
on Fbol is from di Benedetto
1998) and the revised Hipparcos parallax (van Leeuwen 2007). Adopting
L⊙ = 3.842 × 1026 W with an uncertainty of 0.4%
(Bahcall et al. 2001), we found
L = 3.494 ± 0.087 L⊙ for
β Hyi.
A number of determinations of the effective temperature (Teff) of β Hyi can be found in the literature (e.g. Favata et al. 1997; Blackwell & Lynas-Gray 1998; di Benedetto 1998; Santos et al. 2005; da Silva et al. 2006; Biazzo et al. 2007; Bruntt et al. 2010). We adopted the value of North et al. (2007), which is derived from the direct measurement of the angular diameter.
The most recent value for the metallicity of β Hyi is given by Bruntt et al. (2010), [Fe/H] = −0.10 ± 0.07. This value is in agreement with the one found by Santos et al. (2005), [Fe/H] = −0.08 ± 0.04 and with the one adopted by Fernandes & Monteiro (2003), [Fe/H] = −0.12 ± 0.047. In our analysis we adopted the metallicity from Bruntt et al. (2010).
We calculated the mass fraction of metals, Z, from the metallicity using
the following approximation, valid for Population I stars which do not present the
α-elements enrichment seen in metal deficient stars (Wheeler et al. 1989): ![\begin{equation} \begin{split} \label{eq:met} \rm{[Fe/H]_s} & \equiv {\rm{log}} \left( \frac{Z_{\rm{Fe}}}{Z} \right)_{\rm{s}} + {\rm log} \left( \frac{Z}{X} \right)_{\rm{s}} - {\rm log} \left(\frac{Z_{\rm{Fe}}}{Z} \right)_{\odot} - {\rm log} \left( \frac{Z}{X} \right)_{\odot}\\ & = {\rm log} \left( \frac{Z}{X} \right)_{\rm{s}}- {\rm log} \left( \frac{Z}{X} \right)_{\odot}, \end{split} \end{equation}](/articles/aa/full_html/2011/03/aa15370-10/aa15370-10-eq27.png) (2)where [Fe/H] s is the star’s metallicity;
ZFe and X are the iron and hydrogen mass
fractions, respectively; and (Z/X)⊙ is the
ratio for the solar mixture. We used
(Z/X)⊙ = 0.0245 (Grevesse & Noels 1993). This gives
(Z/X) = 0.019 ± 0.003 for β Hyi.
(2)where [Fe/H] s is the star’s metallicity;
ZFe and X are the iron and hydrogen mass
fractions, respectively; and (Z/X)⊙ is the
ratio for the solar mixture. We used
(Z/X)⊙ = 0.0245 (Grevesse & Noels 1993). This gives
(Z/X) = 0.019 ± 0.003 for β Hyi.
 |
Fig. 1 Left panel: the position of β Hyi in the HR diagram. The constraints on the fundamental parameters (Teff, L/L⊙) are indicated by the 1-σ error box (solid) and on the radius by diagonal solid lines. We also show the corresponding 3-σ uncertainties by dashed lines. Two evolutionary tracks for the best models found by method 2 (cf. Table 5) are plotted with dash-dotted and solid curves, representing the models with and without gravitational settling and diffusion, respectively. Right panel: the same as in the left panel but zoomed in. The selected models are marked by filled squares. |
From spectral analysis, Dravins & Nordlund (1990) found vsini = 2 ± 1 km s-1 for β Hyi. More recently, Bruntt et al. (2010) found vsini = 2.7 ± 0.6 km s-1, and Hekker & Aerts (2010) from spectroscopic line-profile analysis, found vsini = 4.3 km s-1. From their analysis, Hekker & Aerts (2010) attempted to determine the inclination angle, i, of β Hyi, suggesting a value of 55 ± 17° for this star. Thus the effect of rotation on the modelling of the structure of the star can be neglected. Similarly, since the resulting rotational splitting is comparable with the error in the observed frequencies (see below), in the present analysis we neglect the effects of rotation on the frequencies.
The position of β Hyi in the HR diagram is shown in Fig. 1 and the fundamental parameters we adopted are given in Table 1.
2.2. Seismic data
Asteroseismic observations of β Hyi have been reported by Bedding et al. (2007). They found an excess power centred around 1 mHz with a peak amplitude of ~50 cm s-1, and the oscillation frequencies show a comb-like structure typical of solar-like oscillations with a large frequency separation of the l = 0 modes, Δν0, of 57.24 ± 0.16 μHz. They also identified 28 mode frequencies in the range 0.7 < ν < 1.4 mHz with the angular degrees l = 0, 1, and 2, three of which were identified as l = 1 mixed modes. In this work, we used the updated list of 33 observed frequencies given in Table 2. To produce these, we reanalysed the 2005 dual-site observations (Bedding et al. 2007) using revised weights that were adjusted using a new method that minimises the sidelobes (Kjeldsen et al., in prep.). This method is described by Bedding et al. (2010), who applied it to multi-site observations of Procyon (see also Arentoft et al. 2009). In the same way as for Procyon, we extracted oscillation frequencies from the time series of β Hyi using the standard procedure of iterative sine-wave fitting. The finite mode lifetime causes many modes to be split into two or more peaks which, coupled with the presence of mode bumping, meant that deciding on a final list of mode frequencies with correct l identifications is somewhat subjective. We followed the same approach as Bedding et al. (2010), which involved using the ridge centroids as a guide and averaging multiple peaks into a single value. The remaining unidentified peaks in the power spectrum are listed in Table 3.
Stellar properties of β Hyi.
3. Modelling β Hyi
3.1. Input physics to the models
To compute the evolutionary models we used the “Aarhus STellar Evolution Code”, ASTEC (Christensen-Dalsgaard 2008a). The following assumptions were made: spherical symmetry, no rotation, no magnetic field and no mass loss. In the computation we used the OPAL 2005 equation of state tables (see Rogers & Nayfonov 2002), OPAL opacities (Iglesias & Rogers 1996) complemented by low-temperature opacities from Ferguson et al. (2005), the solar mixture from Grevesse & Noels (1993), and the NACRE nuclear reaction rates (Angulo et al. 1999). We considered an atmospheric temperature versus optical depth relation which is a fit to the quiet-sun relation of Vernazza et al. (1976).
Convection was treated according to the standard mixing-length theory (MLT) from Böhm-Vitense (1958), where the characteristic length of turbulence, lmix, scales directly with the local pressure scale height, Hp, as lmix = αHp, leaving the scaling factor α as a free parameter. MLT makes use of another free parameter associated with the amount of the core overshooting, αov. Both Di Mauro et al. (2003) and Fernandes & Monteiro (2003) found that models at the position of β Hyi in the HR diagram are not affected by convective overshooting, so we decided, for this work, not to consider it in our models.
Diffusion and settling were treated in the approximations proposed by Michaud & Proffitt (1993). We refer to Christensen-Dalsgaard (2008a) for a detailed explanation.
Observed oscillation frequencies in β Hyi (in μHz) resulting from the revised analysis, listed in ascending radial order within each column.
Unidentified observed peaks with S/N ≥ 3.5.
3.2. Grids of models
Parameters used to compute the evolutionary tracks.
We calculated two grids of evolutionary tracks, Grids I and II, with the input parameters shown in Table 4. In Grid II we included diffusion and gravitational settling of helium.
For each grid, we took those models whose parameters were within the 3-σ uncertainties derived from the observations of β Hyi, and computed the corresponding oscillation frequencies using the Aarhus adiabatic oscillation code ADIPLS (Christensen-Dalsgaard 2008b). The theoretical frequencies were then compared with the observed ones in order to find the best-matching model.
The parameters of the best models found for Grid I (no diffusion) and II (He settling and diffusion), for each of the two methods.
 |
Fig. 2 Échelle diagrams for β Hyi, with a frequency separation of Δν = 57.5 μHz, before (left plot) and after (right plot) application of the near-surface corrections to the model frequencies. Shown are the frequencies of the selected models using method 1, when including no diffusion (upper panel) and diffusion (lower panel). In method 1, the best model was selected using the radial (l = 0) modes alone (see the text for details). The solid symbols show observed frequencies (Table 2), asterisks the unidentified peaks (Table 3), and the open symbols the model frequencies. Circles are used for l = 0 modes, triangles for l = 1, squares for l = 2 and diamonds for l = 3. Open symbols are scaled to represent the relative amplitudes of the modes as predicted by the models. |
 |
Fig. 3 The same as Fig. 2 but for the best models without (upper panel) and with (lower panel) diffusion, selected using method 2, which takes into account the observed and identified modes with all degrees available. |
4. Near-surface corrections
It is well known from helioseismology that there is a systematic offset between the observed and the computed oscillation frequencies of the Sun. This offset, which is nearly independent of the angular degree, l, of the mode and affects the highest frequencies the most (Christensen-Dalsgaard & Thompson 1997), arises from the improper modelling of the surface layers. Therefore, the offset is also expected to be present when comparing the observed and computed frequencies for other stars. Kjeldsen et al. (2008) used the solar data to derive an empirical correction for the near-surface offset, which can, in principle, be applied to other stars.
For the Sun, the difference between the observed, νobs, and
computed frequencies of the best model, νbest, was shown by
Kjeldsen et al. (2008) to be well approximated by a
power law fit given as ![\begin{equation} \label{eq:corre1} \nu_{\rm{obs}}(n) - \nu_{\rm{best}}(n) = a \left[ \frac{\nu_{\rm{obs}}(n)}{\nu_{0}} \right]^b, \end{equation}](/articles/aa/full_html/2011/03/aa15370-10/aa15370-10-eq82.png) (3)where n is the radial order,
and ν0 is a reference frequency that is chosen to be the
frequency at maximum power. Since the offset is independent of l, the
authors considered only radial (l = 0) modes. Note that the “best model” is
the one that best represents the interior but still fails to model the near-surface layers.
They also argued that the frequencies of a reference model,
νref, which is close to the best one, can be scaled from
νbest by a factor r, i.e.,
(3)where n is the radial order,
and ν0 is a reference frequency that is chosen to be the
frequency at maximum power. Since the offset is independent of l, the
authors considered only radial (l = 0) modes. Note that the “best model” is
the one that best represents the interior but still fails to model the near-surface layers.
They also argued that the frequencies of a reference model,
νref, which is close to the best one, can be scaled from
νbest by a factor r, i.e.,  (4)Then Eq. (3) becomes
 ![\begin{equation} \label{eq:corre2} \nu_{\rm{obs}}(n) - r \nu_{\rm{ref}}(n) = a \left[ \frac{\nu_{\rm{obs}}(n)}{\nu_{0}} \right]^b\cdot \end{equation}](/articles/aa/full_html/2011/03/aa15370-10/aa15370-10-eq87.png) (5)Kjeldsen et al.
(2008), using the data and models for the Sun, found b = 4.90.
Using this value for b it is possible to determine r
and a from Eqs. (6) and (10) in Kjeldsen
et al. (2008). Assuming that a similar offset occurs for other solar-like stars,
they showed how to use the solar b to determine r
and a from the observed frequencies of l = 0 modes, and,
consequently, use Eq. (5) to calculate the
correction that must be applied to the frequencies computed for all l for a
given stellar model. They noted that the correction applied to the mixed modes should be
less than that for the pure p modes (see the next section).
(5)Kjeldsen et al.
(2008), using the data and models for the Sun, found b = 4.90.
Using this value for b it is possible to determine r
and a from Eqs. (6) and (10) in Kjeldsen
et al. (2008). Assuming that a similar offset occurs for other solar-like stars,
they showed how to use the solar b to determine r
and a from the observed frequencies of l = 0 modes, and,
consequently, use Eq. (5) to calculate the
correction that must be applied to the frequencies computed for all l for a
given stellar model. They noted that the correction applied to the mixed modes should be
less than that for the pure p modes (see the next section).
5. Selecting the best model
We considered two methods to find the model that to the closest extent possible reproduces the observed non-seismic and seismic data for β Hyi. For all models whose parameters were within the 3-σ uncertainties derived from the non-seismic observations of β Hyi, we calculated the r and a values, following Kjeldsen et al. (2008), using b = 4.90 and ν0 = 1000 μHz.
In the first method we followed closely the work of Kjeldsen et al. (2008) and considered the best representative model to be the one
having the value of r closest to 1, which means, from Eq. (4),  (6)Using the values of r and
a found for this model, we then computed the correction factor to be
applied to the model frequencies and compared them with those observed. Note, however, that
in this method r is calculated using only the observed radial modes
together with the corresponding model radial modes. If we assume that the best model is the
one which has r closest to 1 then we are assuming the model that has the
radial frequencies matching most closely the observed l = 0 modes also has
the nonradial frequencies matching best the observed l = 1 and 2 modes,
which may not be true.
(6)Using the values of r and
a found for this model, we then computed the correction factor to be
applied to the model frequencies and compared them with those observed. Note, however, that
in this method r is calculated using only the observed radial modes
together with the corresponding model radial modes. If we assume that the best model is the
one which has r closest to 1 then we are assuming the model that has the
radial frequencies matching most closely the observed l = 0 modes also has
the nonradial frequencies matching best the observed l = 1 and 2 modes,
which may not be true.
In the second method we performed a statistical analysis, using the
χ2 test. Our goal was to find the reference model that, after
applying the surface corrections, had the individual frequencies closest to the observed
ones, for all l, i.e. we found the minimum of  (7)where N is the total number of
modes considered, νref,corr(n,l) are the
frequencies of modes with radial order n and degree l of a
reference model, corrected for the surface effects, and σ represents the
uncertainty in the observed frequencies.
(7)where N is the total number of
modes considered, νref,corr(n,l) are the
frequencies of modes with radial order n and degree l of a
reference model, corrected for the surface effects, and σ represents the
uncertainty in the observed frequencies.
The correction term, as shown in the right-hand side of Eq. (3) can only be applied to the frequencies of the best model. In order to
compute the correction term, since we have a set of reference models and we do not know
which one is the best model, we assume that the corrected best
νbest,corr and reference model
νref,corr frequencies also scale as  (8)We note that this is a good approximation
because the surface corrections to the frequencies are much smaller than the frequencies
themselves. Moreover, since
νbest,corr ≃ νobs we have
(8)We note that this is a good approximation
because the surface corrections to the frequencies are much smaller than the frequencies
themselves. Moreover, since
νbest,corr ≃ νobs we have
![\begin{equation} \label{eq:corr5} \nu_{\rm{ref,corr}} (n,0) = \nu_{\rm{ref}}(n,0)+ \left(\frac{a}{r}\right) \left[\frac{\nu_{\rm{obs}} (n,0)}{\nu_0}\right]^b\cdot \end{equation}](/articles/aa/full_html/2011/03/aa15370-10/aa15370-10-eq99.png) (9)Thus, Eq. (7) becomes
(9)Thus, Eq. (7) becomes ![\begin{equation} \label{eq:chi2m1} \chi^2=\frac{1}{N} \sum_{n,l} \left(\frac{\nu_{\rm{ref}}(n,l)+\left(\frac{a}{r}\right) \left[\frac{\nu_{\rm{ref}} (n,l)}{\nu_0}\right]^b-\nu_{\rm{obs}}(n,l)}{\sigma (\nu_{\rm{obs}}(n,l))}\right)^2\cdot \end{equation}](/articles/aa/full_html/2011/03/aa15370-10/aa15370-10-eq100.png) (10)Note that, in practice, the term
(a/r) [νobs(n,0)/ν0] b
on the right-hand side of Eq. (9) was
replaced by
(a/r) [νref(n,l)/ν0] b.
The reason is to enable us to correct all the reference model frequencies, instead of only
the frequencies having the same radial order as those observed. The difference between these
terms is minimal for the best-fitting model, and so we are safe in performing the
replacement.
(10)Note that, in practice, the term
(a/r) [νobs(n,0)/ν0] b
on the right-hand side of Eq. (9) was
replaced by
(a/r) [νref(n,l)/ν0] b.
The reason is to enable us to correct all the reference model frequencies, instead of only
the frequencies having the same radial order as those observed. The difference between these
terms is minimal for the best-fitting model, and so we are safe in performing the
replacement.
To compute χ2 we used all the observed and computed
l = 0,1, and 2 frequencies. However, as already mentioned, some of the
observed l = 1 modes are mixed modes and the scaling is not valid for them.
Mixed modes should not be affected by the surface layers as much as the p modes (Kjeldsen et al. 2008), so the correction term should be
small for the mixed modes. Specifically, at a given frequency we expect the near-surface
effects to scale inversely with the mode inertia, which is much higher for the mixed modes
than for the p modes; thus we scaled the correction term by the inverse of the ratio
Qnl between the inertia of the mode and the
inertia of a radial mode of the same frequency (Aerts et al.
2010). Taking that into account, Eq. (10) becomes ![\begin{equation} \label{eq:chi2m2} \chi^2=\frac{1}{N} \sum_{n,l} \left(\frac{\nu_{\rm{ref}}(n,l)+\left(\frac{1}{Q_{nl}}\right) \left(\frac{a}{r}\right) \left[\frac{\nu_{\rm{ref}} (n,l)}{\nu_0}\right]^b-\nu_{\rm{obs}}(n,l)}{\sigma (\nu_{\rm{obs}}(n,l))}\right)^2\cdot \end{equation}](/articles/aa/full_html/2011/03/aa15370-10/aa15370-10-eq105.png) (11)In this method, our best model is the one that
minimises Eq. (11).
(11)In this method, our best model is the one that
minimises Eq. (11).
Contrary to the first method, the χ2 test takes into account all the individual frequencies, including mixed modes. This test also includes the uncertainties in the observations. Thus, it is possible that the model with the lowest χ2 does not have the r that is closest to 1.
6. Results and discussion
The parameters of the best models found for Grids I and II, using the two methods described in Sect. 5, are shown in Table 5. Figures 2 and 3 show the échelle diagrams for β Hyi. An échelle diagram shows the frequency spectrum divided into segments equally spaced by the large frequency separation, after these segments are stacked in the vertical direction (Grec et al. 1983). In these figures the observed frequencies of β Hyi are compared with the theoretical frequencies of the best models from Grid I (upper panel) and from Grid II (lower panel), both before (left plot) and after (right plot), applying the near-surface corrections. The model frequencies are represented by open symbols and the observed frequencies (cf. Table 2) by solid symbols, while the asterisks represent the unidentified peaks (cf. Table 3), which may correspond to genuine modes, sidelobes, or noise peaks. The relative sizes of the open symbols reflect the expected mode amplitudes (Christensen-Dalsgaard et al. 1995). The so-called mixed modes reveal themselves in the échelle diagrams, breaking the regularity of the ridges. The models predict mixed modes with all nonradial degrees, however mostly with too small amplitudes to be observed. On the other hand, some of the observed modes match well the mixed modes with l = 1 (see, e.g., the right panels of Fig. 3). If we inspect Figs. 2 and 3, it is clear that the agreement between the observed and model frequencies is much better when method 2 is used (Fig. 3). This is due to the fact that in this method all the available seismic constraints were involved in selecting the best model.
It is seen from Table 5 that the model that has the r value closest to unity does not produce the lowest χ2 value. The model with the lowest χ2 still has an r satisfactorily close to unity. So, in addition to finding a model that represents the stellar interior reasonably, method 2 makes sure that all the available seismic constraints are simultaneously reproduced and so the fit, and hence the accuracy of the model, is improved substantially. This shows the importance of the individual modes in constraining the range of models to represent the observed star. Mixed modes, in particular, put strong constraints on the model properties, especially on the evolutionary stage. For instance, we can see from the right panels of Fig. 2 that two models resulting from method 1 have the two highest χ2 values due to failing to match particularly the observed l = 1 mixed modes. In the upper right panel, the model is too massive and it matches the rest of the seismic constraints before it is sufficiently evolved to have mixed modes, whereas the model in the lower right panel does have mixed modes, although the predicted mixed modes do not match those observed.
In general, we found that the empirical surface corrections proposed by Kjeldsen et al. (2008) work very well for β Hyi as seen from Figs. 2 and 3, although there is room for improvement for high-frequency modes of l = 1. The reason for the suboptimal agreement for those modes is that the correction term is determined using only the l = 0 observed modes, whose frequencies span a smaller range than those of the l = 1 modes. Thus, radial modes with higher frequencies need to be detected in order to improve the agreement for the higher frequency l = 1 modes. Note that the change in the large frequency separation of the models after applying the near-surface correction is around 0.8 μHz, which is larger than the given uncertainty of the observed large separation. This should be taken into account when modelling through a pipeline analysis that uses the large separation as input. It is encouraging to see that we can observe l = 3 modes, and that some of the unidentified modes are also close to the model frequencies, namely 753.1 μHz (l = 1?) and 1462.6 μHz (l = 0?).
Even though the best model seems to be the one without diffusion, we do expect that within a star diffusion occurs. The two selected models, the ones with and without diffusion, resulting from the method 2 are in fact compatible and both could be further fine-tuned.
7. Summary and conclusions
We computed two grids of evolutionary models, using the ASTEC code, in order to find the model that most closely reproduces the seismic and non-seismic data of β Hyi. The parameters used for each grid are given in Table 1. We computed the oscillation frequencies for the models that lie inside the 3-σ error box of the star’s position in the HR diagram with the ADIPLS code, and compared them with the observed frequencies. There is an offset needed to be taken into account in this comparison, due to improper modelling of the near-surface layers of the stars. We used the approach proposed by Kjeldsen et al. (2008) to correct the computed frequencies of β Hyi from this offset. We used two methods in order to find the model that reproduces the observed oscillation frequencies of β Hyi.
In our analysis, we argue that the method involving the χ2 test, method 2, is the most robust way to find the best model, since it takes into account all the individual frequencies, the mixed modes, and also the uncertainties on the observed frequencies. Analysing the échelle diagrams of the representative models found with method 2 (cf. Sect. 6), we see that the surface correction works very well for l = 0 modes, and for l = 1 and 2 modes with frequencies lying in the frequency range of the observed radial modes. This was expected since the correction term was computed using only those radial modes. Observed l = 0 modes with higher frequencies are thus needed in order to improve the surface correction.
Our best models give M = 1.04 M⊙ and an age of
6.1–7.3 Gyr for β Hyi, depending on the inclusion of gravitational settling
and diffusion of helium. In either case, the radius is found to be
R ~ 1.785 R⊙, which is in good
agreement with the one determined by interferometry,
R = 1.809 ± 0.015 R⊙. However, there are
other models fitting the data similarly well. We used the parameters of those models (with
χ2 < 10) to determine the internal error regarding our
analysis. We calculated the mean value, and the uncertainties were taken as the standard
deviation. We found M = 1.08 ± 0.03 M⊙,
age = 6.40 ± 0.56 Gyr, and
R = 1.811 ± 0.020 R⊙. These results are also
consistent with the results of Fernandes & Monteiro
(2003), who derived,  M⊙ and
M = 1.09 ± 0.22 M⊙, through the HR diagram
analysis and Δν0, respectively, and a stellar age between 6.4
and 7.1 Gyr.
M⊙ and
M = 1.09 ± 0.22 M⊙, through the HR diagram
analysis and Δν0, respectively, and a stellar age between 6.4
and 7.1 Gyr.
Acknowledgments
This work was partially supported by the project PTDC/CTE-AST/098754/2008 and the grant SFRH/BD/41213/2007 funded by FCT / MCTES, Portugal. M.C. is supported by a Ciência 2007 contract, funded by FCT/MCTES (Portugal) and POPH/FSE (EC). G.D., J.C.D., and H.K. are grateful for the financial support from the Danish Natural Science Research Council. TRB is supported by Australian Research Council. NCAR is supported by the U.S. National Science Foundation.
References
- Aerts, C., Christensen-Dalsgaard, J., & Kurtz, D. W. 2010, Asteroseismol. (Heidelberg: Springer) [Google Scholar]
- Aizenman, M., Smeyers, P., & Weigert, A. 1977, A&A, 58, 41 [NASA ADS] [Google Scholar]
- Angulo, C., Arnould, M., Rayet, M., et al. 1999, Nucl. Phys. A, 656, 3 [NASA ADS] [CrossRef] [Google Scholar]
- Arentoft, T., Kjeldsen, H., & Bedding, T. R. 2009, ASP Conf. Ser. 416, ed. M. Dikpati, T. Arentoft, I. González Hernández, C. Lindsey, & F. Hill, 347 [Google Scholar]
- Bahcall, J. N., Pinsonneault, M. H., & Basu, S. 2001, ApJ, 555, 990 [NASA ADS] [CrossRef] [Google Scholar]
- Bedding, T. R., Butler, R. P., Kjeldsen, H., et al. 2001, ApJ, 549, L105 [NASA ADS] [CrossRef] [Google Scholar]
- Bedding, T. R., Kjeldsen, H., Arentoft, T., et al. 2007, ApJ, 663, 1315 [NASA ADS] [CrossRef] [Google Scholar]
- Bedding, T. R., Kjeldsen, H., Campante, T. L., et al. 2010, ApJ, 713, 935 [NASA ADS] [CrossRef] [Google Scholar]
- Biazzo, K., Pasquini, L., Girardi, L., et al. 2007, A&A, 475, 981 [NASA ADS] [CrossRef] [EDP Sciences] [Google Scholar]
- Blackwell, D. E., & Lynas-Gray, A. E. 1998, A&AS, 129, 505 [Google Scholar]
- Böhm-Vitense, E. 1958, Z. Astrophys., 46, 108 [Google Scholar]
- Bruntt, H., Bedding, T. R., Quirion, P., et al. 2010, MNRAS, 746 [Google Scholar]
- Carrier, F., Bouchy, F., Kienzle, F., et al. 2001, A&A, 378, 142 [NASA ADS] [CrossRef] [EDP Sciences] [Google Scholar]
- Christensen-Dalsgaard, J. 2008a, Ap&SS, 316, 13 [NASA ADS] [CrossRef] [Google Scholar]
- Christensen-Dalsgaard, J. 2008b, Ap&SS, 316, 113 [NASA ADS] [CrossRef] [Google Scholar]
- Christensen-Dalsgaard, J., & Thompson, M. J. 1997, MNRAS, 284, 527 [NASA ADS] [Google Scholar]
- Christensen-Dalsgaard, J., Bedding, T. R., & Kjeldsen, H. 1995, ApJ, 443, L29 [NASA ADS] [CrossRef] [Google Scholar]
- Cunha, M. S., Aerts, C., Christensen-Dalsgaard, J., et al. 2007, A&AR, 14, 217 [Google Scholar]
- da Silva, L., Girardi, L., Pasquini, L., et al. 2006, A&A, 458, 609 [NASA ADS] [CrossRef] [EDP Sciences] [Google Scholar]
- di Benedetto, G. P. 1998, A&A, 339, 858 [NASA ADS] [Google Scholar]
- Di Mauro, M. P., Christensen-Dalsgaard, J., & Paternò, L. 2003, Ap&SS, 284, 229 [NASA ADS] [CrossRef] [Google Scholar]
- Doǧan, G., Brandão, I. M., Bedding, T. R., et al. 2009, Ap&SS, 251 [Google Scholar]
- Dravins, D., & Nordlund, A. 1990, A&A, 228, 203 [NASA ADS] [Google Scholar]
- Dravins, D., Linde, P., Ayres, T. R., et al. 1993a, ApJ, 403, 412 [NASA ADS] [CrossRef] [Google Scholar]
- Dravins, D., Linde, P., Fredga, K., & Gahm, G. F. 1993b, ApJ, 403, 396 [NASA ADS] [CrossRef] [Google Scholar]
- Dravins, D., Lindegren, L., Nordlund, A., & Vandenberg, D. A. 1993c, ApJ, 403, 385 [NASA ADS] [CrossRef] [Google Scholar]
- Edmonds, P. D., & Cram, L. E. 1995, MNRAS, 276, 1295 [NASA ADS] [Google Scholar]
- Evans, D. S., Menzies, A., & Stoy, R. H. 1957, MNRAS, 117, 534 [NASA ADS] [Google Scholar]
- Favata, F., Micela, G., & Sciortino, S. 1997, A&A, 323, 809 [NASA ADS] [Google Scholar]
- Ferguson, J. W., Alexander, D. R., Allard, F., et al. 2005, ApJ, 623, 585 [NASA ADS] [CrossRef] [Google Scholar]
- Fernandes, J., & Monteiro, M. J. P. F. G. 2003, A&A, 399, 243 [NASA ADS] [CrossRef] [EDP Sciences] [Google Scholar]
- Frandsen, S. 1987, A&A, 181, 289 [NASA ADS] [Google Scholar]
- Gray, R. O., Corbally, C. J., Garrison, R. F., et al. 2006, AJ, 132, 161 [NASA ADS] [CrossRef] [Google Scholar]
- Grec, G., Fossat, E., & Pomerantz, M. A. 1983, Sol. Phys., 82, 55 [NASA ADS] [CrossRef] [Google Scholar]
- Grevesse, N., & Noels, A. 1993, in Origin and Evolution of the Elements, ed. S. Kubono, & T. Kajino, 14 [Google Scholar]
- Hekker, S., & Aerts, C. 2010, A&A, 515, A43 [NASA ADS] [CrossRef] [EDP Sciences] [Google Scholar]
- Hoffleit, D., & Warren, J. W. H. 1995, VizieR Online Data Catalog: V/50, SIMBAD [Google Scholar]
- Iglesias, C. A., & Rogers, F. J. 1996, ApJ, 464, 943 [NASA ADS] [CrossRef] [Google Scholar]
- Kjeldsen, H., Bedding, T. R., & Christensen-Dalsgaard, J. 2008, ApJ, 683, L175 [NASA ADS] [CrossRef] [Google Scholar]
- Michaud, G., & Proffitt, C. R. 1993, in Inside the Stars, ed. W. W. Weiss, & A. Baglin, IAU Coll., 137, ASP Conf. Ser., 40, 246 [Google Scholar]
- North, J. R., Davis, J., Bedding, T. R., et al. 2007, MNRAS, 380, L80 [NASA ADS] [CrossRef] [Google Scholar]
- Osaki, J. 1975, PASJ, 27, 237 [NASA ADS] [Google Scholar]
- Perryman, M. A. C., & ESA 1997, The HIPPARCOS and TYCHO catalogues, Astrometric and photometric star catalogues derived from the ESA HIPPARCOS Space Astrometry Mission, ESA SP, 1200, [Google Scholar]
- Rogers, F. J., & Nayfonov, A. 2002, ApJ, 576, 1064 [Google Scholar]
- Santos, N. C., Israelian, G., Mayor, M., et al. 2005, A&A, 437, 1127 [NASA ADS] [CrossRef] [EDP Sciences] [Google Scholar]
- van Leeuwen, F. 2007, A&A, 474, 653 [NASA ADS] [CrossRef] [EDP Sciences] [Google Scholar]
- Vernazza, J. E., Avrett, E. H., & Loeser, R. 1976, ApJS, 30, 1 [NASA ADS] [CrossRef] [Google Scholar]
- Wheeler, J. C., Sneden, C., & Truran, J. J. W. 1989, ARA&A, 27, 279 [NASA ADS] [CrossRef] [Google Scholar]
All Tables
Observed oscillation frequencies in β Hyi (in μHz) resulting from the revised analysis, listed in ascending radial order within each column.
The parameters of the best models found for Grid I (no diffusion) and II (He settling and diffusion), for each of the two methods.
All Figures
|
Fig. 1 Left panel: the position of β Hyi in the HR diagram. The constraints on the fundamental parameters (Teff, L/L⊙) are indicated by the 1-σ error box (solid) and on the radius by diagonal solid lines. We also show the corresponding 3-σ uncertainties by dashed lines. Two evolutionary tracks for the best models found by method 2 (cf. Table 5) are plotted with dash-dotted and solid curves, representing the models with and without gravitational settling and diffusion, respectively. Right panel: the same as in the left panel but zoomed in. The selected models are marked by filled squares. |
| In the text | |
|
Fig. 2 Échelle diagrams for β Hyi, with a frequency separation of Δν = 57.5 μHz, before (left plot) and after (right plot) application of the near-surface corrections to the model frequencies. Shown are the frequencies of the selected models using method 1, when including no diffusion (upper panel) and diffusion (lower panel). In method 1, the best model was selected using the radial (l = 0) modes alone (see the text for details). The solid symbols show observed frequencies (Table 2), asterisks the unidentified peaks (Table 3), and the open symbols the model frequencies. Circles are used for l = 0 modes, triangles for l = 1, squares for l = 2 and diamonds for l = 3. Open symbols are scaled to represent the relative amplitudes of the modes as predicted by the models. |
| In the text | |
|
Fig. 3 The same as Fig. 2 but for the best models without (upper panel) and with (lower panel) diffusion, selected using method 2, which takes into account the observed and identified modes with all degrees available. |
| In the text | |
Current usage metrics show cumulative count of Article Views (full-text article views including HTML views, PDF and ePub downloads, according to the available data) and Abstracts Views on Vision4Press platform.
Data correspond to usage on the plateform after 2015. The current usage metrics is available 48-96 hours after online publication and is updated daily on week days.
Initial download of the metrics may take a while.