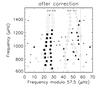
Fig. 2
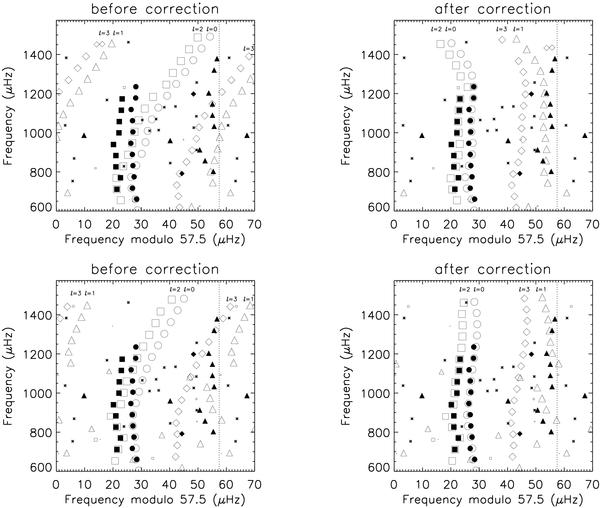
Échelle diagrams for β Hyi, with a frequency separation of Δν = 57.5 μHz, before (left plot) and after (right plot) application of the near-surface corrections to the model frequencies. Shown are the frequencies of the selected models using method 1, when including no diffusion (upper panel) and diffusion (lower panel). In method 1, the best model was selected using the radial (l = 0) modes alone (see the text for details). The solid symbols show observed frequencies (Table 2), asterisks the unidentified peaks (Table 3), and the open symbols the model frequencies. Circles are used for l = 0 modes, triangles for l = 1, squares for l = 2 and diamonds for l = 3. Open symbols are scaled to represent the relative amplitudes of the modes as predicted by the models.
Current usage metrics show cumulative count of Article Views (full-text article views including HTML views, PDF and ePub downloads, according to the available data) and Abstracts Views on Vision4Press platform.
Data correspond to usage on the plateform after 2015. The current usage metrics is available 48-96 hours after online publication and is updated daily on week days.
Initial download of the metrics may take a while.