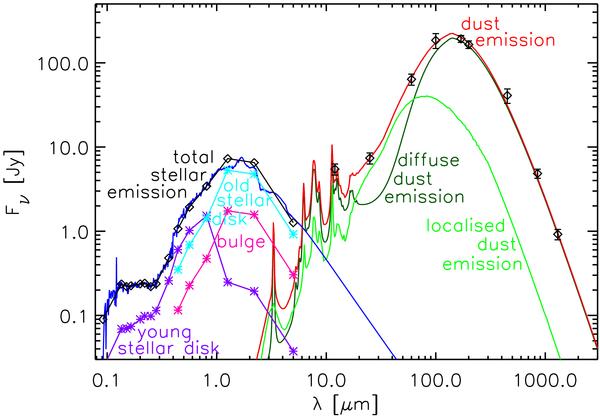
Fig. 8

The best fit model SED of NGC 891, corresponding to
 ,
SFR = 2.88 M⊙/yr,
F = 0.41, together with the observed data in the MIR/FIR/submm
(plotted as rhombus symbols with error bars). The observed flux densities and the
corresponding references are given in Table 1. The calculated total intrinsic stellar SED is plotted as black line and
rhombus symbols. The predicted stellar SED given by population synthesis models is
plotted as dark blue line. The intrinsic stellar SED of the young stellar population
in the diffuse component (the fraction 1 − F escaping the
star-forming complexes) is plotted with mauve line. The intrinsic SED (only diffuse)
of the old stellar population, as derived from the optimisation of the optical/NIR
images of NGC891, is plotted with light blue line. The corresponding SED for the
bulge is plotted with pink line. The different symbols overplotted on the UV/optical
SEDs indicate the wavelength at which the radiative transfer calculations were
performed. The predicted PAH and dust emission SED is given with red line. Also
plotted are the two main components of infrared emission: the predicted diffuse SED
(dark-green line) and the predicted clumpy component associated with the
star-forming regions (light-green line).
Current usage metrics show cumulative count of Article Views (full-text article views including HTML views, PDF and ePub downloads, according to the available data) and Abstracts Views on Vision4Press platform.
Data correspond to usage on the plateform after 2015. The current usage metrics is available 48-96 hours after online publication and is updated daily on week days.
Initial download of the metrics may take a while.


