Fig. 6
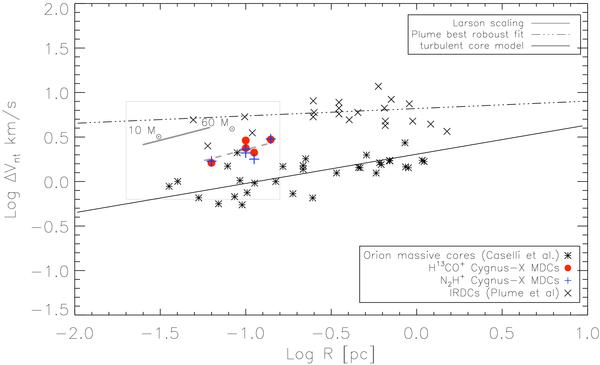
We plot line-widths (FWHM) of the Cygnus-X MDCs (red large dots and blue crosses) versus the core size taken from Motte et al. (2007). Black symbols indicate line-widths taken from the literature (Caselli & Myers 1995). Black line indicates a Larson like line-widths size-relation, while the dashed-dotted line is adopted from Plume et al. (1997) representing their best robust fit to their observed line-width size-relation of IRDCs. Gray line indicates the fiducial model of McKee & Tan (2003) with a surface density of ~1.7 g cm-2 and a final stellar mass of 10 to 60 M⊙. Dashed gray line indicates the same model with a clump surface density 3 times lower. A small box indicates the data presented in Fig. 10.
Current usage metrics show cumulative count of Article Views (full-text article views including HTML views, PDF and ePub downloads, according to the available data) and Abstracts Views on Vision4Press platform.
Data correspond to usage on the plateform after 2015. The current usage metrics is available 48-96 hours after online publication and is updated daily on week days.
Initial download of the metrics may take a while.