Free Access
Fig. C.2
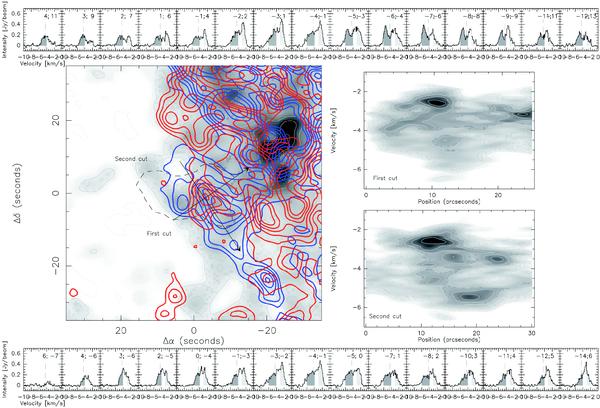
CygX-N48 as in Fig. 8. Integration range for the gray scale is −4 to −3 km s-1, red contours show an integration range between −3 and −1 km s-1, blue contours are integrated between −6 and −4 km s-1. Contour levels go from 10 × rms noise in steps of 3 × rms noise.
Current usage metrics show cumulative count of Article Views (full-text article views including HTML views, PDF and ePub downloads, according to the available data) and Abstracts Views on Vision4Press platform.
Data correspond to usage on the plateform after 2015. The current usage metrics is available 48-96 hours after online publication and is updated daily on week days.
Initial download of the metrics may take a while.