Free Access
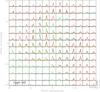
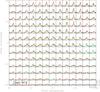
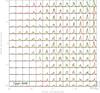
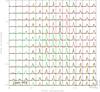
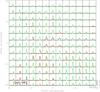
Fig. B.1

Spectral decomposition of the line-components seen in 30 m+PdBI H13CO+ spectra maps. Black line shows the observed spectra, while red and green lines show the resulting fits of two components. We show only the components with a S/N > 5.
This figure is made of several images, please see below:
Current usage metrics show cumulative count of Article Views (full-text article views including HTML views, PDF and ePub downloads, according to the available data) and Abstracts Views on Vision4Press platform.
Data correspond to usage on the plateform after 2015. The current usage metrics is available 48-96 hours after online publication and is updated daily on week days.
Initial download of the metrics may take a while.