Fig. 10
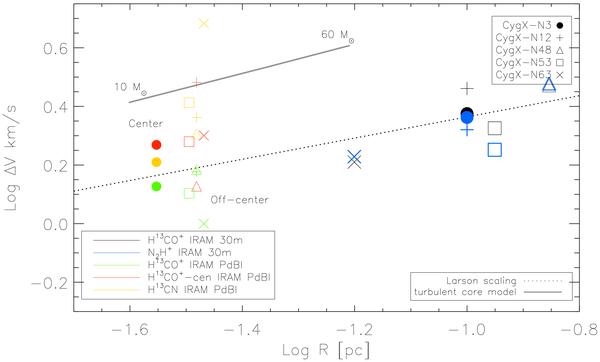
We plot line-widths of the MDCs taken from single-dish and high angular-resolution data. The corresponding sizes are taken from Motte et al. (2007) for the single-dish data, while for the high angular-resolution data sizes show the synthesized beam of the PdBI. The Larson-scaling is indicated by a dotted line. Gray line indicates the fiducial model of McKee & Tan (2003) with a surface density of ~1.7 g cm-2 and a final stellar mass of 10–60 M⊙. Different colors indicate the different tracers observed with only single-dish or with the interferometer.
Current usage metrics show cumulative count of Article Views (full-text article views including HTML views, PDF and ePub downloads, according to the available data) and Abstracts Views on Vision4Press platform.
Data correspond to usage on the plateform after 2015. The current usage metrics is available 48-96 hours after online publication and is updated daily on week days.
Initial download of the metrics may take a while.