Fig. 3
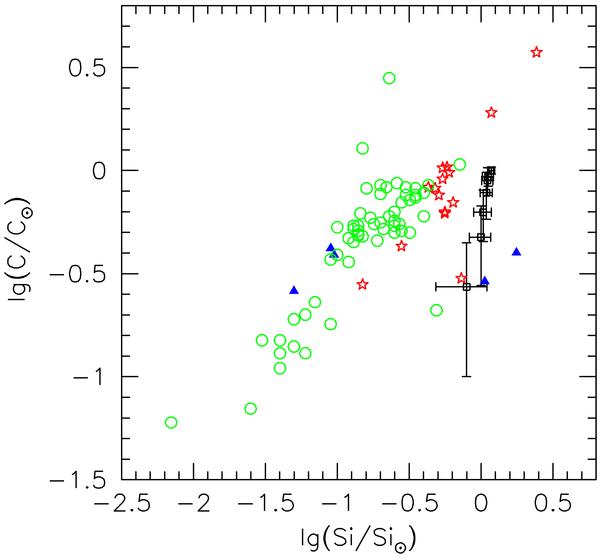
Abundances of the dust locked up into the grains along our anomalous sight lines compared with the solar values (see text); (green) open circles are for type C curves, and (black) squares represent normal curves computed with WD parameters corresponding to seven different RV values, i.e. forty-nine models (Sect. 3). We also include the results of type A and B extinction models (Paper I), (red) stars and (blue) filled triangles, respectively, revised here to account for the latest model updates (Draine & Li 2007) (see text).
Current usage metrics show cumulative count of Article Views (full-text article views including HTML views, PDF and ePub downloads, according to the available data) and Abstracts Views on Vision4Press platform.
Data correspond to usage on the plateform after 2015. The current usage metrics is available 48-96 hours after online publication and is updated daily on week days.
Initial download of the metrics may take a while.