Fig. 2
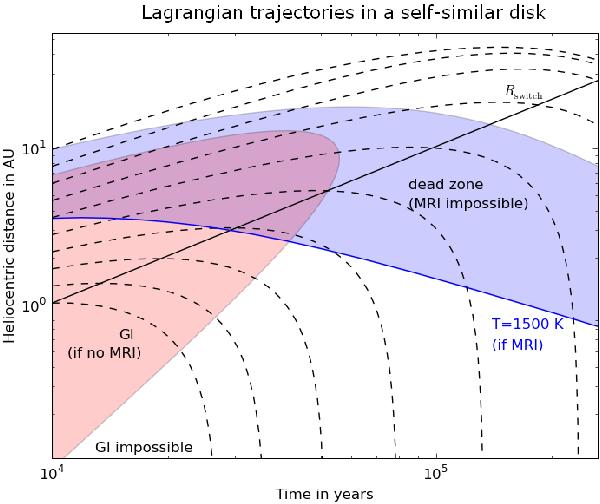
Space-time diagram of the self-similar model. Dashed lines mark the trajectory of CAIs with ρsa = 1 kg/m2 and the black continuous line indicates the locus of Rswitch. The MRI-inactive areas are shaded in blue (dead zone), with the 1500 K isotherm (a typical CAI condensation temperature) drawn as a continuous blue line. Regions prone to GI in the absence of viscous dissipation are shaded in red. Once the (GI-free) dead zone reaches a significant fraction of the disk mass, the disk model is no longer self-consistent, and disk evolution is expected to slow down, as is the sunward drift of CAIs in the dead zone. The conclusion is that CAIs can be transported to the dead zone before its formation.
Current usage metrics show cumulative count of Article Views (full-text article views including HTML views, PDF and ePub downloads, according to the available data) and Abstracts Views on Vision4Press platform.
Data correspond to usage on the plateform after 2015. The current usage metrics is available 48-96 hours after online publication and is updated daily on week days.
Initial download of the metrics may take a while.