| Issue |
A&A
Volume 526, February 2011
|
|
|---|---|---|
| Article Number | L6 | |
| Number of page(s) | 4 | |
| Section | Letters | |
| DOI | https://doi.org/10.1051/0004-6361/201016002 | |
| Published online | 20 December 2010 | |
Letters to the Editor
X-shooter observations of the accreting brown dwarf J053825.4-024241⋆
1
Osservatorio Astrofisico di Arcetri, INAF, Largo E. Fermi 5, 50125
Firenze, Italy
e-mail: This email address is being protected from spambots. You need JavaScript enabled to view it.
2
Università di Firenze, Dipartimento di Astronomia,
Largo E.Fermi 2, 50125
Firenze,
Italy
3
School of Cosmic Physics, Dublin Institute for Advanced
Studies, Dublin 2,
Republic of Ireland
4
ESO, Karl Schwarschild Strasse 2, 85748
Garching bei München,
Germany
5
Osservatorio Astronomico di Capodimonte, INAF,
80131
Napoli,
Italy
6
Max-Planck-Institut fur extraterrestriche Physik,
85741
Garching bei München,
Germany
Received:
26
October
2010
Accepted:
9
December
2010
Abstract
We present the first observations of a probable brown dwarf, obtained with the new spectrograph X-shooter mounted on the UT2@VLT. The target (2MASS J053825.4-024241) is a 0.06 M⊙ object in the star-formation region σ Ori. The X-shooter spectrum covers simultaneously the whole range from UV to NIR (300–2500 nm). The J053825.4-024241 spectrum is rich in emission lines that are typical of accreting young object and clearly shows the Balmer jump. Moreover, many photospheric atomic and molecular absorption lines yield the spectral type and confirm that the object is young. We compute the mass accretion rate from all available observed accretion diagnostics. We find that there is a large spread in the Ṁacc values (up to a factor 40) that is not caused by variability; some of this spread may be intrinsic, i.e., owing to different physical conditions of the emitting region for the same Ṁacc. However, within the large error bars all Ṁacc measurements agree, and the mean value is logṀacc ~ −9.86 ± 0.45 M⊙/y. The hydrogen Balmer lines are clearly detected up to n = 25. Their ratios suggest that the emitting region is cold (T ~ 2000−3000 K), dense and in thermal equilibrium (LTE), and that the lines are optically thick up to n ~ 21. We briefly discuss the implications of this result for magnetospheric accretion models.
Key words: stars: formation / accretion, accretion disks
Based on observations collected at the European Southern Observatory, Chile. Program 084.C-0269(A).
© ESO, 2010
1. Introduction
Accretion and ejection of matter play a fundamental role in shaping the structure and evolution of proto-planetary disks. In the last years, our understanding of these processes has progressed significantly, confirming the role played by accretion and magnetic fields, but at the same time raising new questions. A large number of observational diagnostics need to be observed simultaneously to avoid the problems related to the time variability that characterize pre-main sequence stars. X-shooter, the new spectrometer at VLT/ESO, is the optimum instrument for this purpose, with its large wavelength range (300–2500 nm) that is covered simultaneously.
This letter reports the first observations of a brown dwarf carried out with X-shooter. The target J053825.4-024241 (J0538 in the following) in the σ Ori star-forming region (D ~ 360 pc, Béjar et al. 2001), was first identified as a photometric sub-stellar candidate by Béjar et al. (2004), and was then extensively studied by Caballero et al. (2006), who concluded that J0538 is a likely cluster member, with heliocentric radial velocity vh = 32 ± 13 km s-1, spectral type M6 ± 1, and a mass estimated from evolutionary models of M ~ 0.06 M⊙. J0538 is detected by Spitzer at all IRAC wavelengths and at 24 μm with MIPS (Hernández et al. 2007). Its spectral energy distribution (SED) shows a clear excess over the photospheric emission from the K band, which is indicative of a circumstellar disk surrounding the brown dwarf.
2. Observations and analysis
The observations were obtained with X-shooter within the INAF/GTO program on star-forming regions. Observations were performed in visitor mode during the night of the 2009 December 23; exposure time was 6 × 900 s, which allows us to reach a signal-to-noise ratio in the continuum from ~7 (UVB-arm) to ~30 (VIS-arm) and ~80 (NIR-arm), depending on the echelle order.
The target was observed with the 11′′ × 1.0′′ slit in the UVB-arm and with 11′′ × 0.9′′ slit in the VIS and NIR-arms. The spectral resolution R is ~5100 over the UVB and the NIR-arm, and ~8800 in the VIS-arm. Raw data were reduced using the EsoRex pipeline (version 0.9.4) following the standard steps, which include bias subtraction, flat-fielding, optimal extraction, wavelength calibration, sky subtraction, and flux-calibration.
The extraction of the 1D spectra and the subsequent data analysis was performed with the IRAF1 package. The flux calibration of the star was performed using a spectrophotometric standard (GD71-V13.06) observed close in time and airmass to J0538. The spectrum of J0538 shows strong emission lines of H, He i, Ca ii, [O i] as well as photospheric atomic absorption lines of Li and K and broad molecular absorption bands such as TiO. Balmer continuum emission is also clearly detected. Some regions of the stellar spectrum in the three arms are plotted in Figs. 1 and 2. The properties of some selected lines are given in Table 1.
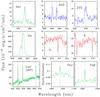 |
Fig. 1 Spectra of selected lines, as labeled. Green spectra show lines used to derive the mass accretion rates, red spectra show absorption features, and blue spectra wind diagnostic lines. |
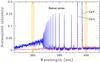 |
Fig. 2 Spectrum of J0538 (solid/blue line) in the region near the Balmer jump. Dashed/red line refers to a template spectrum of a class III low-mass star in σ Ori with spectral type M6.5. The two shaded intervals indicate where the fluxes @ 360 nm and @ 400 nm have been derived. |
Properties of selected lines.
3. The brown dwarf J053825.4-024241
J0538 (SO500 in Hernández et al. 2007) shows spectroscopic features that are typical of low-gravity atmospheres (rather weak K iλλ766.5,769.9 nm and Na iλλ818.3,819.5 nm absorption lines), which support the assumption of the youth of the object and its membership to the σ Ori cluster. Lithium at λ670.8 nm is detected in absorption, as expected. However, the observed lithium pseudo-equivalent width (pEW) (~0.33 ± 0.02 Å) is found to be rather low with respect to the theoretical pEWs obtained by Palla et al. (2007) for undepleted lithium. This discrepancy possibly stems from a lack of understanding of the details of the formation of the lithium line, or of the internal structure of young low-mass stars (Johnas et al. 2007).
The spectral type, determined by the comparison between the optical spectrum of the object with field dwarf template spectra (Kirkpatrick et al. 1993), is M7 ± 0.5 (Teff ~ 2900 K, following the temperature scale of Luhman 1999) and agree well with the determination obtained by Caballero et al. (2006). The optical extinction to the cluster is negligible (Oliveira et al. 2004) and the estimated stellar luminosity for the adopted distance is ~0.025 ± 0.005 L⊙, based on the spectral type and on the average I and J magnitudes (Rigliaco et al. 2011, and references therein). Based on its location on the HR diagram and on a comparison with the Baraffe et al. (1998) evolutionary tracks, J0538 has a mass of about 0.06 M⊙ (not larger than 0.08 M⊙ considering all the uncertainties), and an age ~1 Myr, apparently slightly younger than the bulk of the σ Ori stars (e.g., Rigliaco et al. 2011).
4. Mass accretion rate
The X-shooter spectrum of J0538 is rich in emission in lines and continuum, which are powered by processes related to the accretion from the circumstellar disk onto the central object. These diagnostics are used to derive the mass accretion rate from empirical relations between the observed line or continuum excess luminosity and the accretion luminosity or the mass accretion rates (see, e.g., Herczeg & Hillenbrand 2008, hereafter HH08, and references therein). These relations were calibrated on a relatively small sample of well-studied objects, mostly T Tauri stars, for which the accretion luminosity was derived by fitting the observed optical veiling with magnetospheric accretion models (Gullbring et al. 1998; Calvet et al. 2004), or, for brown dwarfs, the Hα profiles (Muzerolle et al. 2005).
We compute the Ṁacc values from the Hα luminosity according to the relation in Fang et al. (2009), the Hβ luminosity (Fang et al. 2009), the Hγλ434.0 nm and H9λ383.5 nm luminosity (HH08), the NaIλ589.0 nm line luminosity (HH08) and the He iλ587.6 nm luminosity (Fang et al. 2009). An independent value of the mass accretion rate (logṀacc − 9.6 ± 0.5 M⊙/y) is derived from the width of the Hα line at 10% of the peak (~340 km s-1), using the relation derived by Natta et al. (2004).
The NIR hydrogen recombination lines Paβ and Paγ have also been extensively used as proxy of the accretion luminosity (e.g., Muzerolle et al. 1998); mass accretion rates from these lines have been derived using the relationships in Natta et al. (2004) and Gatti et al. (2008). All these values of Ṁacc are given in Table 1.
The Ca ii infrared triplet lines are attributed to accretion shocks very close to the stellar surface. Mohanty et al. (2005) showed that the Ca iiλ866.2 is a good proxy of the mass accretion rate in very low-mass stars; the value of Ṁacc derived from their correlation for brown dwarfs and very low-mass objects is also given in Table 1, together with the Ṁacc computed from the Ca ii 854.2 nm line (HH08).
The Balmer jump and Balmer continuum emission in the U-band are powerful diagnostics of accretion. Plane-parallel slab models from Valenti et al. (1993) are used to calculate the bolometric correction, which is then applied to the excess continuum emission. The excess emission is estimated by subtracting a photospheric template. We find logṀacc ~ −9.94 ± 0.4 M⊙/y following the procedure of HH08 and adopting as photospheric template the class III object 2MASS J05383858-0241558 (SO641 in Hernandez et al. 2007) observed close in time and airmass to J0538 (spectral type M6.5, obtained from the X-shooter spectrum with the same procedure as J0538).
Figure 3 shows the Ṁacc values derived from the X-shooter spectrum. In most cases the uncertainties on Ṁacc are dominated by the uncertainties on the adopted correlations with Lacc (or, in some cases, Ṁacc). Figure 3 also shows the mass accretion rate obtained by Rigliaco et al. (2011) from the U band excess emission (not simultaneous to the X-shooter spectrum), recomputed for the spectroscopic spectral type derived in Sect. 3 (logṀacc ~ −9.7 ± 0.7 M⊙/y).
Even when accretion indicators are observed simultaneously, the spread between different values of Ṁacc is quite large, of the order on ±0.8 dex. However, all values are consistent within the large error bars, and the average Ṁacc has an uncertainty of less than a factor of 3 (logṀacc ~ −9.86 ± 0.45 M⊙/y). On the other hand, the large scatter may reflect a real spread in the values of the secondary indicators for fixed accretion luminosity, owing to, e.g., different stellar and/or disk properties, different regimes of mass accretion, or differences in wind/jet contributions. When a significant number of X-shooter spectra of young objects that are distributed over a large range of masses in different star-forming regions will become available, it will be possible to define and understand the relations between Lacc and the observable emission in lines and continuum much better.
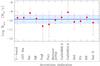 |
Fig. 3 Mass accretion rates determined from different indicators, as labeled. The solid line shows the mean Ṁacc value, the shaded region the ± 1σ uncertainty. |
5. Mass loss rate
The presence of forbidden lines such as [O i]λ630.0 nm and [S ii]λλ671.6,673.1 nm is an indication of jets or outflows from the system (e.g., Hartigan et al. 1995; Whelan et al. 2009). The most prominent optical forbidden line detected in the J0538 spectrum is the [O i] line, while the [S ii] lines are not detected. At the resolution of X-shooter, the [O i] line shows an asymmetric profile, with stronger red-shifted than blue-shifted emission (see Fig. 1). From the [O i] line luminosity we derive an average mass loss rate of Ṁwind ~ 4.5 × 10⁻¹² M⊙/y, following Hartigan et al. (1995), including their assumptions that V⊥ ~ 150 km s-1 for the outflow velocity, that the electron density is ne ~ 7.0 × 104 cm-3 (used because [S ii] lines are not detected), and that the outflow fills our 1-arcsec beam (l⊥ ~ 5.4 × 1015 cm).
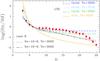 |
Fig. 4 Hn/Hδ line flux ratio versus the quantum number n of the upper level of the transition. The dots show the observed values. Short-dashed, long-dashed and dot-dashed lines plot the ratios for optically thick lines, LTE level populations at three different temperatures, as labeled. The solid line shows the results for LTE, optically thin lines. Predictions of Case B calculations for two different values of the electron density and T = 3000 K are shown by the dotted and the short-long dashed line. |
The value of Ṁwind is rather uncertain, given the assumptions on V⊥, l⊥, and ne. However, the inferred ratio of the mass loss rate to the mass accretion rate (~0.03) is typical of T Tauri stars (Hartigan et al. 1995; White & Hillenbrand 2004) and agrees with the expectation of accretion-driven jets and winds (e.g., Shu et al. 1994; Pudritz et al. 2007).
6. Physical condition of the emitting gas
The many hydrogen emission lines detected in the J0538 spectrum can provide information on the physical conditions of the emitting gas.
Figure 4 shows the ratio of the Balmer line fluxes normalized to Hδ, the strongest line with an almost symmetric profile. For comparison, we computed the expected ratios for optically thick, LTE lines over a large range of temperatures, as well as the Case B predictions, which assume that all lines are optically thin (Storey & Hummer 1995) for different temperatures and electron densities. We show in the figure the best-fitting curves.
The line ratios are well fitted by optically thick, LTE emission at relatively low temperature (2000–3000 K). The highest Balmer lines (n ≥ 21) are weaker than predicted when compared to Hδ, probably because they become more and more optically thin. The Case B models do not provide an equally good fit. The infrared lines are relatively weak, with Brγ not detected. The observed values of Paβ/Hγ(~0.2) and Paγ/Hδ(~0.4), which refer to lines coming from the same upper levels, are higher than expected in the optically thin case, but much lower than expected if all lines were optically thick and coming from the same physical region. The observed ratio Paβ/Paγ(~0.9) is consistent with optically thick, LTE gas at T ~ 3000 K. Our interpretation is that the hydrogen recombination lines come from dense, relatively cold gas in thermal equilibrium, with different lines sampling regions of a different physical size.
The physical conditions of the emitting gas inferred from the hydrogen spectrum are not consistent with the predictions of the magnetospheric accretion models, in which the lines form at temperature of several thousand degrees (6000 ≤ T ≤ 12 000 K, Muzerolle et al. 2001, 2005) in the column of gas accreting onto the star. Gatti et al. (2006) found that at low mass accretion rates the region emitting the hydrogen lines is more likely to be the shocked photosphere, where the infalling matter impacts onto the star.
7. Conclusions
We present the first observations of a young, accreting brown dwarf in σ Ori (J053825.4-024241) obtained with the new spectrograph X-shooter, which provides a simultaneous, medium resolution, high-sensitivity spectrum over the entire wavelength range from ~300 to ~2500 nm. The spectrum shows a large number of lines and excess continuum emission, which are typical signatures of the accretion-related phenomena that dominate the spectrum of young stars, as well as a number of absorption features that allow us to classify the object (M7 ± 0.5), estimate its mass (M ~ 0.06 M⊙), and confirm its youth.
We estimate the mass accretion rate from 12 different accretion indicators simultaneously observed with X-shooter. The accretion rate determinations have a minimum-maximum spread of a factor of 30 for the different methods; when using all values, we significantly reduce the uncertainty and obtain logṀacc = −9.86 ± 0.45 M⊙/y, similar to the non-simultaneous determination from the U-band excess emission (Rigliaco et al. 2011). J0538 is one of the most variable objects observed among very low-mass stars and brown dwarfs in the σ Ori cluster (Caballero et al. 2006); the X-shooter spectrum proves that the large discrepancies between Ṁacc values found by different techniques by various authors do not only depend on variability, but also on the uncertainties of the relations between the observed properties, such as line luminosities, and Lacc.
The spectrum of J0538 shows emission in the [O i]λ630.0 nm line, which we interpret as evidence of mass ejection with logṀwind ~ −11.4 M⊙/y. The ratio Ṁwind/Ṁacc is ~0.03, which is low, but within the range observed in T Tauri stars (Hartigan et al. 1995).
The large number of hydrogen recombination lines in the X-shooter spectrum allows us to study the physical conditions of the emitting gas. We find that Balmer lines (up to n ~ 21) are optically thick and likely produced in a cold (T ~ 2000−3000 K) dense region where LTE conditions hold. These conditions are not thought to be found in the accretion columns from the disk onto the central object, in which the gas is expected to be at several thousand degrees. Gatti et al. (2006) found similar conditions in few brown dwarfs in Ophiuchus, accreting at low Ṁacc, and suggested that the lines (in that case Paβ and Brγ) were likely formed in the shocked photosphere of the central object. The results for J0538 indicate that this may indeed be common, at least in very low-mass objects. Bary et al. (2008) obtained low-resolution infrared spectra of a number of more massive T Tauri stars and compared the Paschen and Bracket decrement to optically thick, LTE emission and to the predictions of Case B. They found better agreement for Case B (i.e., for optically thin lines), for high density and temperatures similar to the values we find in J0538. X-shooter will produce in the immediate future a large number of spectra of brown dwarfs and T Tauri stars with resolution and sensitivity much higher than those available to Bary et al. (2008), which will allow us to better constrain the accretion models.
iraf is distributed by National Optical Astronomy Observatories, which is operated by the Association of Universities for Research in Astronomy, Inc., under cooperative agreement with the National Science Foundation.
Acknowledgments
We would like to dedicate this letter to the memory of Roberto Pallavicini, who prematurely passed away before seeing the X-shooter first light.
References
- Baraffe, I., Chabrier, G., Allard, F., et al. 1998, A&A, 337, 403 [NASA ADS] [Google Scholar]
- Bary, J. S., Matt, S. P., Skrutskie, M. F., et al. 2008, ApJ, 687, 376 [NASA ADS] [CrossRef] [Google Scholar]
- Béjar, V., Martín, E., Zapatero-Osorio, M. R., et al. 2001, ApJ, 556, 830 [NASA ADS] [CrossRef] [Google Scholar]
- Béjar, V., Zapatero Osorio, M. R., & Rebolo, R. 2004, AN, 325, 705 [Google Scholar]
- Caballero, J., Martin, E., et al. 2006, A&A, 445, 143 [NASA ADS] [CrossRef] [EDP Sciences] [Google Scholar]
- Calvet, N., Muzerolle, J., & Briceño, C. 2004, AJ, 128, 1294 [NASA ADS] [CrossRef] [Google Scholar]
- Fang, M., van Boekel, R., Wang, W., et al. 2009, A&A, 504, 461 [NASA ADS] [CrossRef] [EDP Sciences] [Google Scholar]
- Gatti, T., Testi, L., Natta, A., et al. 2006, A&A, 460, 547 [NASA ADS] [CrossRef] [EDP Sciences] [Google Scholar]
- Gatti, T., Natta, A., Randich, S., et al. 2008, A&A, 481, 423 [NASA ADS] [CrossRef] [EDP Sciences] [Google Scholar]
- Gullbring, E., Hartmann, L., Briceño, C., & Calvet, N. 1998, ApJ, 492, 323 [NASA ADS] [CrossRef] [Google Scholar]
- Johnas, C., Guenther, E., Joergens, V., et al. 2007, A&A, 475, 667 [NASA ADS] [CrossRef] [EDP Sciences] [Google Scholar]
- Hartigan, P., Edwards, S., & Ghandour, L. 1995, ApJ, 452, 736 [NASA ADS] [CrossRef] [Google Scholar]
- Herczeg, G., & Hillenbrand, L. A. 2008, ApJ, 681, 594 [NASA ADS] [CrossRef] [Google Scholar]
- Hernández, J., Hartmann, L., Megeath, S., et al. 2007, ApJ, 662, 1067 [NASA ADS] [CrossRef] [Google Scholar]
- Kirkpatrick, J., Kelly, D., Rieke, G., et al. 1993, ApJ, 402, 643 [NASA ADS] [CrossRef] [Google Scholar]
- Luhman, K. L. 1999, ApJ, 525, 466 [NASA ADS] [CrossRef] [Google Scholar]
- Mohanty, S., Basri, G., & Jayawardhana, R. 2005, Astron. Nachr., 326, 891 [NASA ADS] [CrossRef] [Google Scholar]
- Muzerolle, J., Hartmann, L., & Calvet, N. 1998, AJ, 116, 455 [NASA ADS] [CrossRef] [Google Scholar]
- Muzerolle, J., Calvet, N., & Hartmann, L. 2001, ApJ, 550, 994 [Google Scholar]
- Muzerolle, J., Luhman, K., Briceño, C., et al. 2005, ApJ, 625, 906 [NASA ADS] [CrossRef] [Google Scholar]
- Natta, A., Testi, L., Muzerolle, J., et al. 2004, A&A, 424, 603 [NASA ADS] [CrossRef] [EDP Sciences] [Google Scholar]
- Oliveira, J., Jeffries, R., & van Loon, J. 2004, MNRAS, 347, 1327 [NASA ADS] [CrossRef] [Google Scholar]
- Palla, F., Randich, S., Pavlenko, Y. V., et al. 2007, ApJ, 659, 41 [Google Scholar]
- Pudritz, R., Ouyed, R., Fendt, Ch., & Brandenburg, A. 2007, PPV, 277 [Google Scholar]
- Rigliaco, E., Natta, S., Randich, S., et al. 2011, A&A, 525, A47 [NASA ADS] [CrossRef] [EDP Sciences] [Google Scholar]
- Shu, F. H., Nijita, J., & Ostriker, E. 1994, ApJ, 419, 781 [NASA ADS] [CrossRef] [Google Scholar]
- Storey, P. J., & Hummer, D. G. 1995, MNRAS, 272, 41 [NASA ADS] [CrossRef] [Google Scholar]
- Valenti, J., Basri, G., & Johns, C. M. 1993, AJ, 106, 2024 [NASA ADS] [CrossRef] [Google Scholar]
- Whelan, E. T., Ray, T. P., Podio, L., et al. 2009, ApJ, 706, 1054 [NASA ADS] [CrossRef] [Google Scholar]
- White, R. J., & Hillenbrand, L. A. 2004, ApJ, 616, 998 [NASA ADS] [CrossRef] [Google Scholar]
All Tables
All Figures
|
Fig. 1 Spectra of selected lines, as labeled. Green spectra show lines used to derive the mass accretion rates, red spectra show absorption features, and blue spectra wind diagnostic lines. |
| In the text | |
|
Fig. 2 Spectrum of J0538 (solid/blue line) in the region near the Balmer jump. Dashed/red line refers to a template spectrum of a class III low-mass star in σ Ori with spectral type M6.5. The two shaded intervals indicate where the fluxes @ 360 nm and @ 400 nm have been derived. |
| In the text | |
|
Fig. 3 Mass accretion rates determined from different indicators, as labeled. The solid line shows the mean Ṁacc value, the shaded region the ± 1σ uncertainty. |
| In the text | |
|
Fig. 4 Hn/Hδ line flux ratio versus the quantum number n of the upper level of the transition. The dots show the observed values. Short-dashed, long-dashed and dot-dashed lines plot the ratios for optically thick lines, LTE level populations at three different temperatures, as labeled. The solid line shows the results for LTE, optically thin lines. Predictions of Case B calculations for two different values of the electron density and T = 3000 K are shown by the dotted and the short-long dashed line. |
| In the text | |
Current usage metrics show cumulative count of Article Views (full-text article views including HTML views, PDF and ePub downloads, according to the available data) and Abstracts Views on Vision4Press platform.
Data correspond to usage on the plateform after 2015. The current usage metrics is available 48-96 hours after online publication and is updated daily on week days.
Initial download of the metrics may take a while.