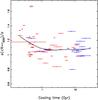
Fig. 9
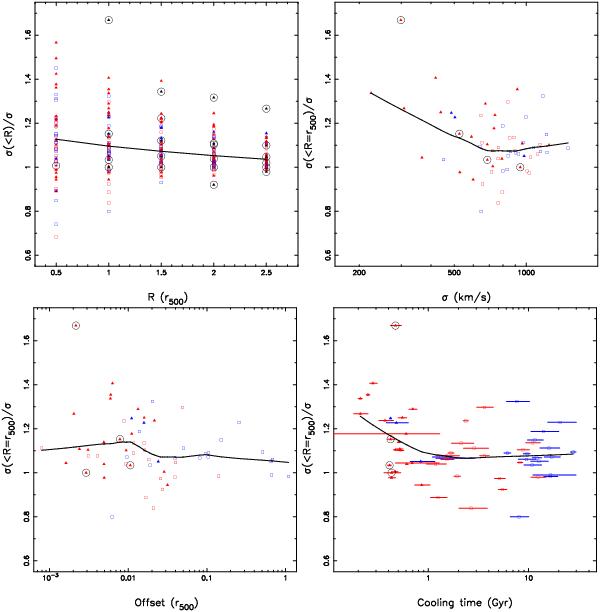
Top-left: velocity dispersion within a projected radius of R normalized by the velocity dispersion within 1.2 Abell radii as a function of the projected radius. We do not include the values for the clusters having fewer than 10 members within the projected radius we are interested. Top-right: normalized velocity dispersion within a projected radius of r500 vs. velocity dispersion. Bottom-left: normalized velocity dispersion within a projected radius of r500 vs. offset between the X-ray flux-weighted center and BCG position. Bottom-right: normalized velocity dispersion within a projected radius of r500 vs. central cooling time. The results are only based on the observational sample of the 62 clusters. The colors and symbols have the same meaning as those in Fig. 3. The curves are the local regression non-parametric fits.
Current usage metrics show cumulative count of Article Views (full-text article views including HTML views, PDF and ePub downloads, according to the available data) and Abstracts Views on Vision4Press platform.
Data correspond to usage on the plateform after 2015. The current usage metrics is available 48-96 hours after online publication and is updated daily on week days.
Initial download of the metrics may take a while.