Fig. 3
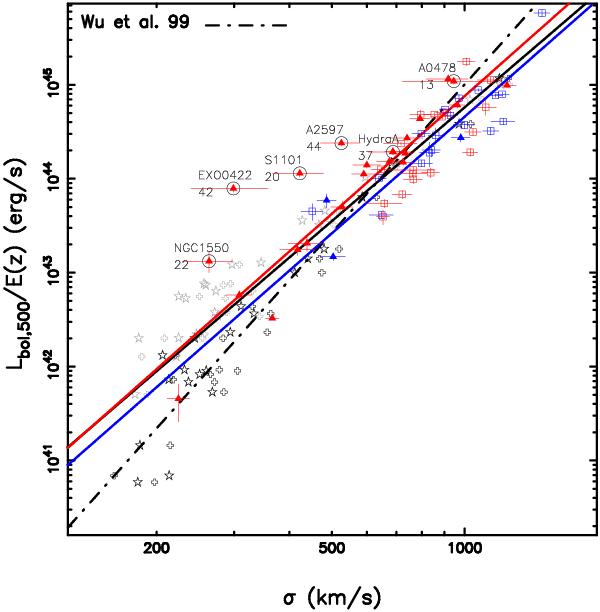
X-ray bolometric luminosity vs. velocity dispersion with luminosity corrected for the cluster core ( ). Our observational sample is shown in red (undisturbed) and blue (disturbed) colors, with filled triangles and open boxes denoting cool-core and non-cool-core clusters. The black circles highlight the six clusters with <45 cluster galaxy redshifts in the determination of the velocity dispersion. The black, red, and blue lines are the best fits using the BCES bisector method for the whole observational sample, subsample of the undisturbed clusters, and subsample of the disturbed clusters, respectively. The simulated sample is shown in black (with AGN feedback) and gray (without AGN feedback) stars using σdirty. Crosses show the corresponding cases using σclean, the velocity dispersion being based only on those galaxies within the virialized region of the cluster and within a projected radius of 1.2 Abell radii for the simulated sample. It is worth noting that no redshift correction and cool-core correction is applied in Wu et al. (1999).
Current usage metrics show cumulative count of Article Views (full-text article views including HTML views, PDF and ePub downloads, according to the available data) and Abstracts Views on Vision4Press platform.
Data correspond to usage on the plateform after 2015. The current usage metrics is available 48-96 hours after online publication and is updated daily on week days.
Initial download of the metrics may take a while.