Fig. A.1
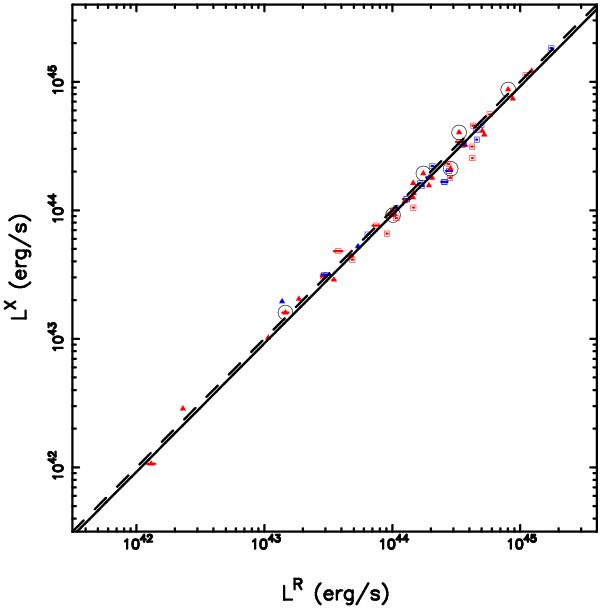
XMM-Newton-ROSAT vs. ROSAT-only measured luminosity in the 0.1–2.4 keV band within r500. The dashed line denotes 1:1. With a fixed slope to 1, the best-fit normalization of the XMM-Newton-ROSAT vs. ROSAT-only measured luminosity for the 62 clusters is 0.92 shown in solid line. The colors and symbols have the same meaning as those in Fig. 3.
Current usage metrics show cumulative count of Article Views (full-text article views including HTML views, PDF and ePub downloads, according to the available data) and Abstracts Views on Vision4Press platform.
Data correspond to usage on the plateform after 2015. The current usage metrics is available 48-96 hours after online publication and is updated daily on week days.
Initial download of the metrics may take a while.