Fig. 13
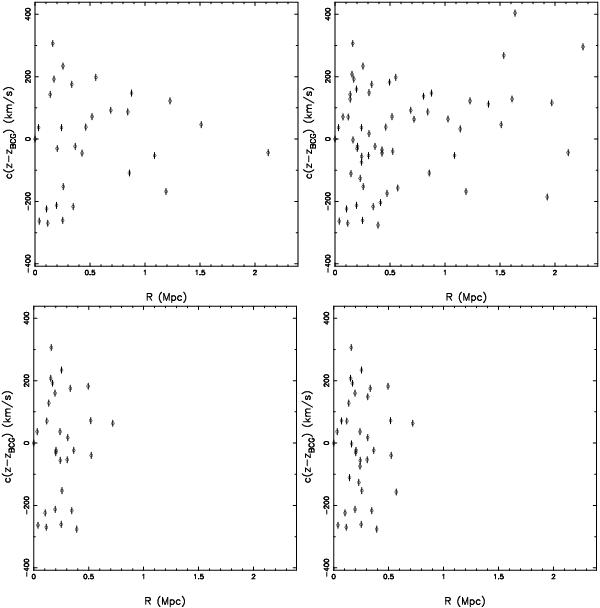
Line-of-sight velocity vs. projected radius of the 30 brightest member galaxies (left panels) and all members within 1.2 Abell radii (right panels), respectively, for a simulated cluster (without AGN feedback) having 40 cluster galaxies when excluding interlopers. The top panels correspond to σdirty, and the bottom panels correspond to σclean.

Current usage metrics show cumulative count of Article Views (full-text article views including HTML views, PDF and ePub downloads, according to the available data) and Abstracts Views on Vision4Press platform.
Data correspond to usage on the plateform after 2015. The current usage metrics is available 48-96 hours after online publication and is updated daily on week days.
Initial download of the metrics may take a while.